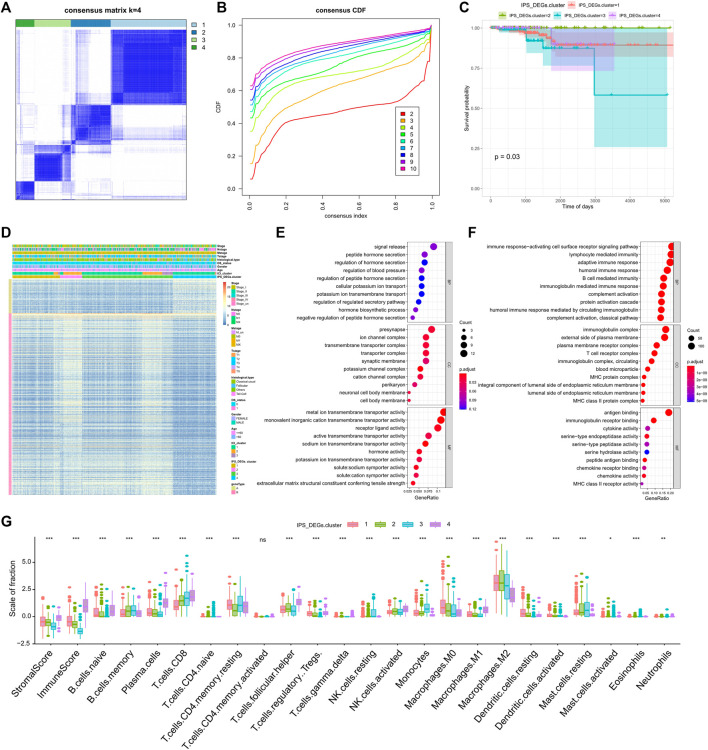
FIGURE 2.
Consistent clustering of differentially expressed genes related to tumor immune antigenicity. (A) Clustering results when k = 4; (B) CDF curve distribution of consistent clustering; (C) Survival curve of molecular subtypes when k = 4; (D) Heat map of immune gene subtypes; (E) Functional enrichment of immune gene subtype related features A gene; (F) Functional enrichment of immune gene subtype related features B gene; (G) Differences in infiltration characteristics of immune cells between immune gene subtypes.

