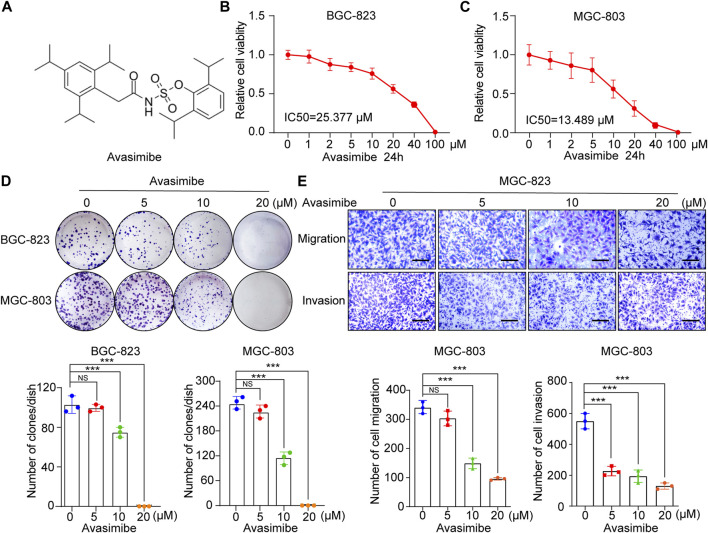
FIGURE 4.
Avasimibe inhibits GC cell growth and metastasis. (A) Molecular structure of avasimibe. (B,C) Relative cell viability was measured by CCK-8 assay after avasimibe treatment for 24 h at multiply concentrations (0, 1, 2, 5, 10, 20, 40, and 100 μM). (D) Representative images of colony formation assay in BGC-823 and MGC-803 cells after avasimibe treatment (upper panel); the quantitative results were shown (lower panel). (E) Transwell assay in MGC-803 cells after avasimibe treatment. Representative images of migrated and invaded GC cells in each group were shown in the left panel, and the quantitative results were shown in the right panel. Scale bars: 100 µm.

