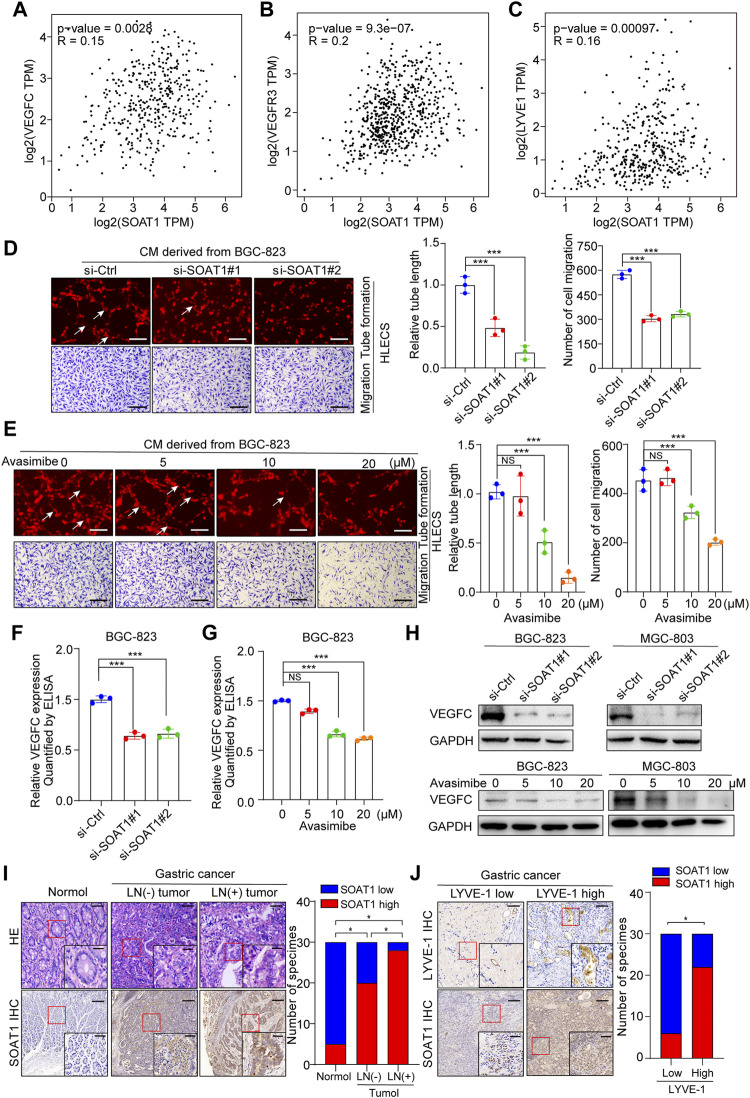
FIGURE 6.
SOAT1 promotes lymphangiogenesis and lymph node metastasis in GC. (A–C) The correlation of SOAT1 expression with VEGFC, VEGFR3, and LYVE-1 were analyzed via online bioinformatics tool (http://gepia.cancer-pku.cn/). (D,E) Representative images (left panel) and quantitative analysis (right panel) of tube formation and transwell migration assays of HLECs cultured with conditioned medium collected from SOAT1-knockdown (D) or avasimibe-treated (E) BGC-823 cells. Scale bars: 100 µm (F,G) ELISA assay of VEGFC expression in conditioned medium collected from the SOAT1 knockdown or avasimibe treated BGC-823 cells. (H) VEGFC expression at the protein level in BGC-823 and MGC-803 cells were measured by western blot assay after knockdown of SOAT1 or avasimibe treatment. (I) Representative images (left panel) and quantitative analysis (right panel) of SOAT1 IHC staining in paraffin-embedded paired normal tissues, sections of tumors with or without LNM from patients with GC. Scale bars: 200 µm and 50 μm, respectively. (J) Representative images (left panel) and quantitative analysis (right panel) of SOAT1 IHC staining in high or low levels of LYVE-1-positive microvessels in the GC tissues. Scale bars: 200 µm and 50 μm, respectively.

