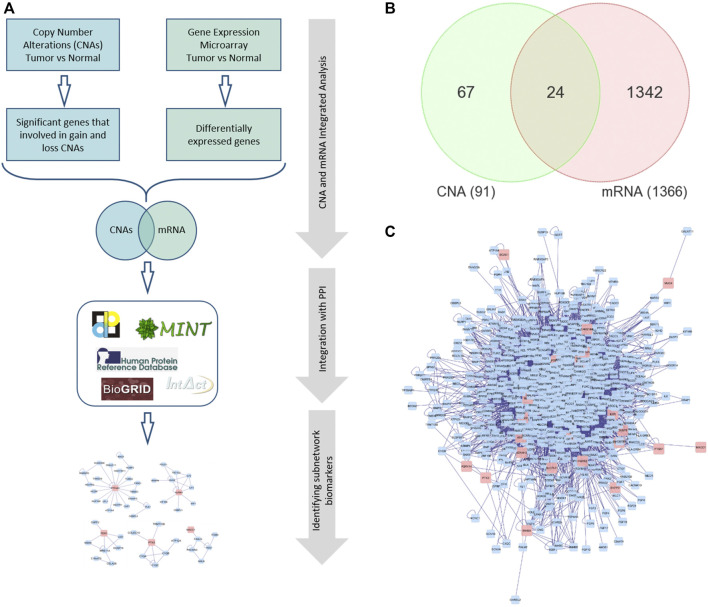
FIGURE 1.
(A) The framework of performing integrated omics and network-based analysis. (B) Venn diagram representing the overlapping DEGs between global mRNA and CNA. (C) A PPI network for the seed/differentially expressed genes. Red nodes indicate the seed genes and the blue ones are the interacting genes. Edges represent the interactions. PPI: Protein-protein interaction.

