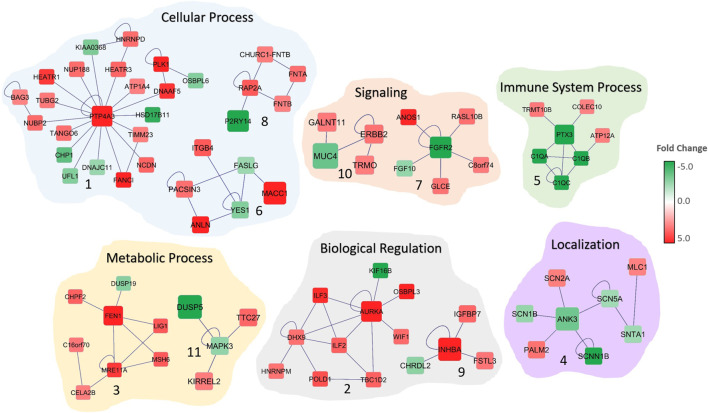
FIGURE 2.
Significant subnetworks associated with colorectal cancer. The color of each gene scales with the fold-change in gene expression in CRC patients compared to normal. Up-regulated genes are indicated in red and down-regulated genes in green. Edges represent the interactions. Biological processes that are associated with the subnetworks are shown.

