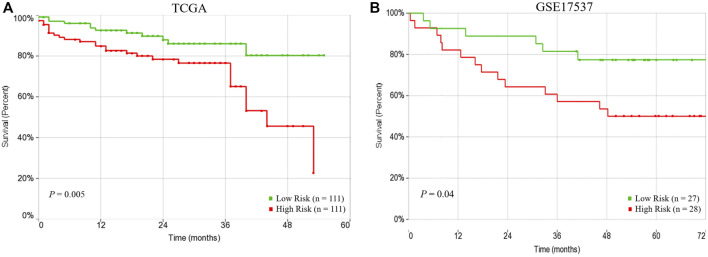
FIGURE 4.
Prognostic performance of risk score based on 15-subnetwork marker in TCGA and GSE17537 CRC cohorts. Kaplan-Meier survival analysis using the 15-subnetwork markers on TCGA cohort (n = 222) (A) and GSE17537 (n = 55) (B). Kaplan-Meier curves for risk groups, red/green curves indicate high/low-risk groups, respectively.

