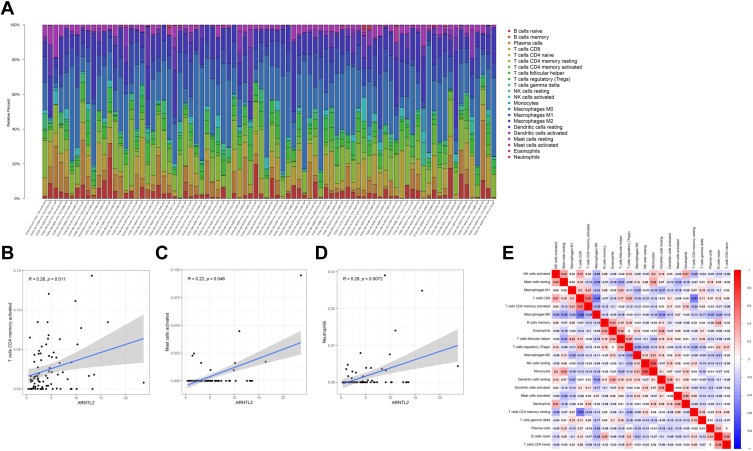
Figure 6.
CIBERSORT analysis of the relationship between ARNTL2 expression and 22 immune cell infiltration in data from TCGA. (A) The stacked bar chart shows the relative fiction of 22 immune cells in each sample. (B–D) The correlation between ARNTL2 expression and activated CD4 memory T cells (B), activated Mast cells (C), and Neutrophils (D). (E) The correlation among different immune cells. The red colour indicates a positive correlation and the blue colour shows a negative correlation.

