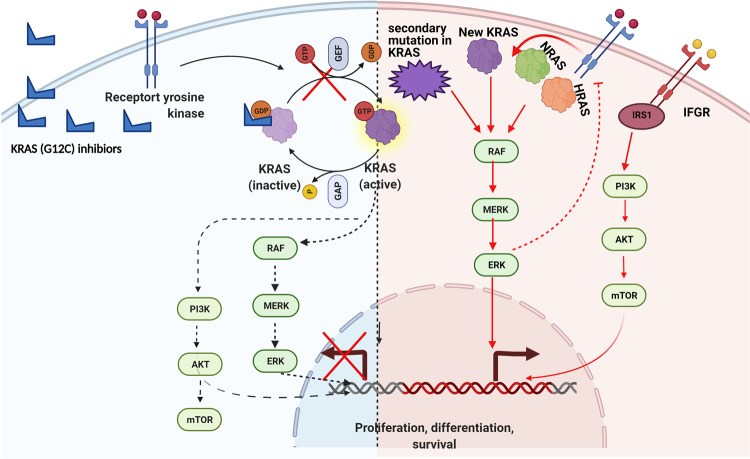
Fig. 7.
Acquired resistance mechanism of covalent KRAS (G12C) inhibitors. The figure on the left blue background represents cells that are sensitive to KRAS (G12C) inhibitors, while the figure on right red background represents cells that are resistant to inhibitors. The black dotted line represents inhibition of KRAS signalling in the presence of KRAS (G12C) inhibitors. The solid red lines represent the resistance mechanisms identified after the use of KRAS (G12C) inhibitors, including the relief of ERK-mediated feedback inhibition, which reactivates the MAPK pathway by wild-type RAS (NRAS and HRAS) or new synthetic KRAS (G12C); the activation of other bypasses, such as PI3K activation by the IGFR–IRS1 pathway and secondary or additional mutations in KRAS. This figure generated from BioRender

