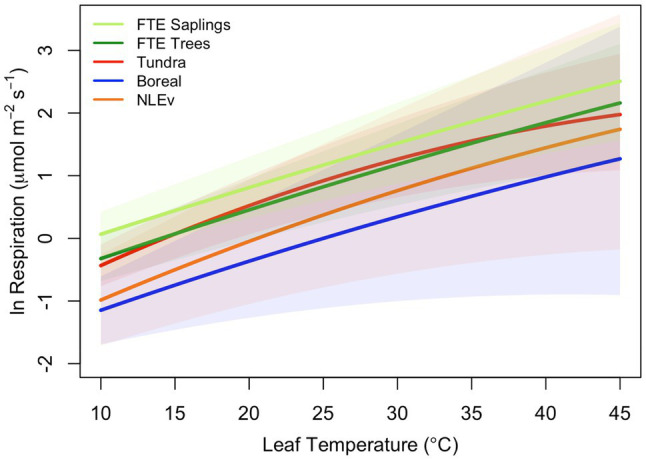
Figure 3.

Comparison of polynomial models fits from Heskel et al. (2016) with the average fits measured on two size classes of Picea glauca at the FTE in Northern Alaska. Response plotted are for the tundra biome (red line), boreal biome (blue line), needle-leaved evergreen plant functional type (orange line), FTE trees (>10cm; dark green line), and FTE saplings (5–10cm DBH; light green line).
