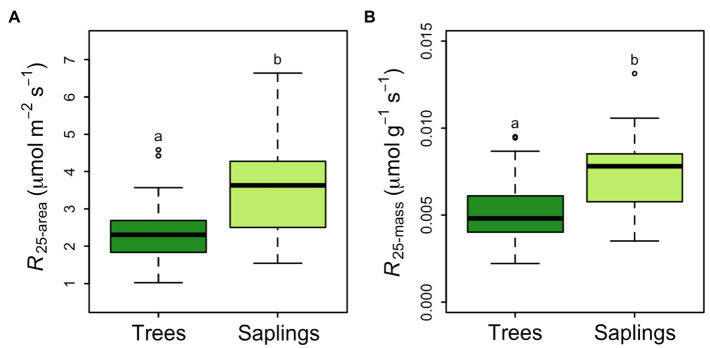
Figure 4.
Picea glauca leaf respiration normalized to 25°C, as a function of tree size at the FTE in Alaska. Respiration is expressed as a function of leaf area (A) and leaf mass (B). Boxplots represent the median and the first and third quartiles. Whiskers delimit the range for each group, with outliers falling outside 1.5 times the interquartile range marked by points. Significant differences between groups are marked by different letters (p<0.05). Dark green boxes=trees ≥10cm DBH, light green boxes=saplings 5–10cm DBH. n=36.

