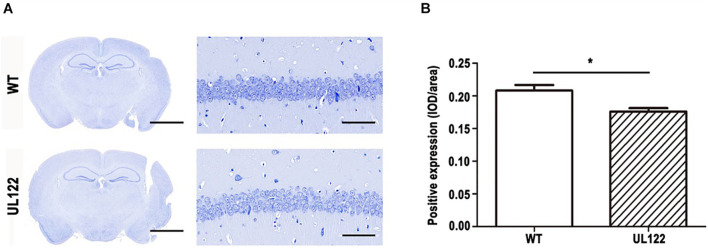
FIGURE 3.
Nissl staining in the hippocampal CA1 region of UL122 mice aged 12 months. (A) Nissl staining of the hippocampal CA1 region of mice aged 12 months. (B) Quantification of Nissl staining. Data were presented as mean ± SEM(n = 5 for each group). Statistical analysis was performed by unpaired t-test. *P < 0.05 vs. the control group. Scale bar on the left is 2,000 μm, scale bar on the right is 50 μm.

