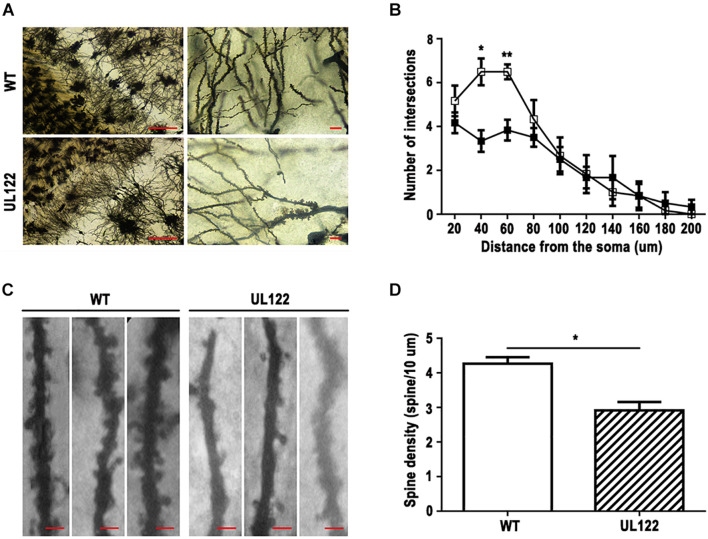
FIGURE 4.
Golgi staining in the hippocampal CA1 region of UL122 mice aged 12 months. (A,B) Representative Golgi-Cox staining of the hippocampal CA1 region (scale bar on the left: 100 μm, scale bar on the right: 10 μm) and quantification of the number of dendritic branches. (C,D) Representative Golgi-Cox staining (scale bar: 10 μm) and quantification of the dendritic spine density. All data were presented as mean ± SEM(n = 10 neurons per mouse, 6 mice per group). Statistical analysis was performed by unpaired t-test. *P < 0.05, **P < 0.01 vs. the control group.

