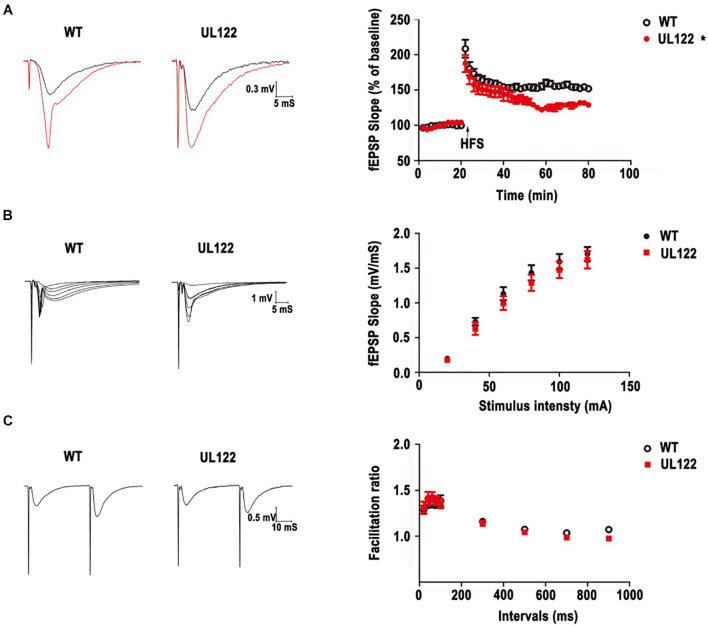
FIGURE 5.
LTP impairment and basal synaptic transmission in WT mice and UL122 mice. (A) Representative traces before (black line) and after (red line) LTP inductions. HFS–induced LTP in hippocampal CA1 neurons from WT mice. *P < 0.05 vs. WT group. (B) The input-output curves at the SC-CA1 pathway in hippocampal slices from WT mice and UL122 mice. n = 10/8 (10 slices from 8 mice) for WT mice, n = 11/8 (11 slices from 8 mice) for UL122 mice. (C) Paired-pulse facilitation at the SC-CA1 pathway in hippocampal slices from WT mice and UL122 mice. n = 10/8 for WT mice, n = 11/8 for UL122 mice. Data were expressed as mean ± SEM. Comparison was made by two-way or one-way analysis of variance. *The slope of EPSPs in the maintaining stage of UL122 mice group was significantly decreased than that of WT mice.

