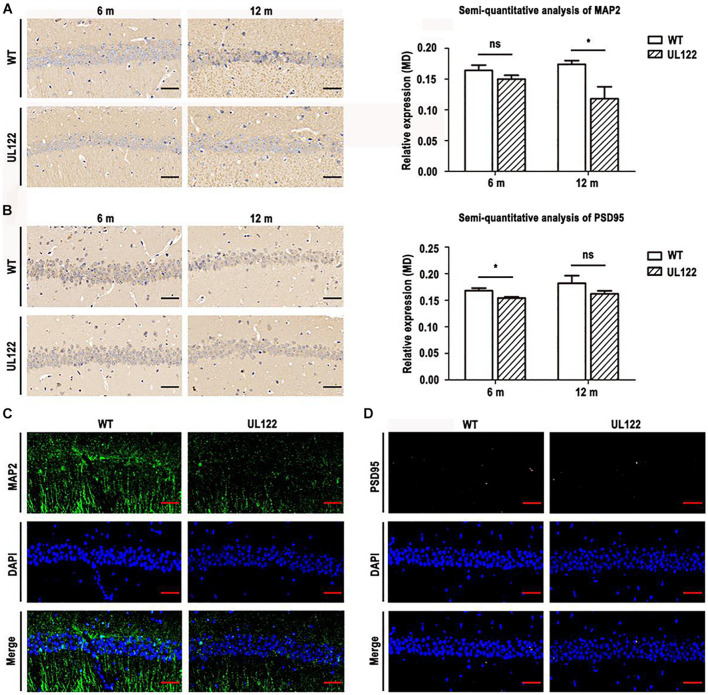
FIGURE 6.
The expression of MAP2 and PSD95 in the hippocampal CA1 region of mice aged 6 and 12 months. (A) MAP2 immunohistochemistry and semi-quantitative analysis of immunohistochemistry for MAP2. (B) PSD95 immunohistochemistry and semi-quantitative analysis of immunohistochemistry for PSD95. (C) The expression of MAP2 and PSD95 in the CA1 region of mice aged 12 months measured by immunofluorescence. (D) The expression of PSD95 in the CA1 region of mice aged 12 months measured by immunofluorescence. MAP2 detected with a primary monoclonal antibody (green), PSD95 detected with a primary monoclonal antibody (pink), nuclei stained with DAPI (blue), merged mage. The bars indicate the means ± SEM(n = 4 for each group). Statistical analysis was performed by unpaired t-test. *P <0.05: significantly different from the WT group.

