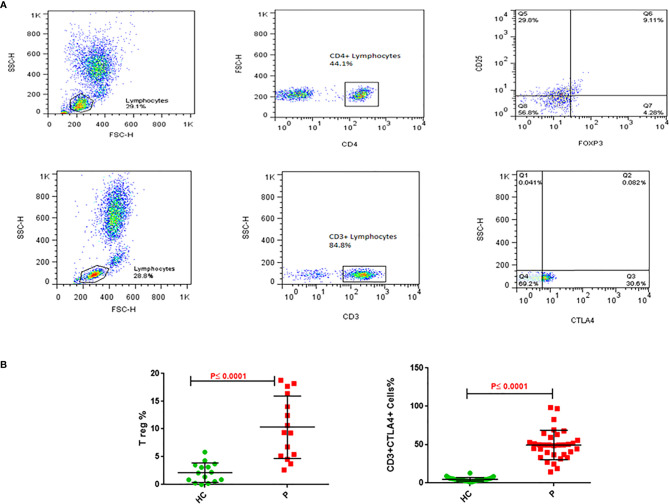
Figure 3.
Treg and CD3/CTLA-4 cells in blood of NSCLC patients. (A) Upper panel: Gating strategy for Treg cells frequency; analysis of a blood sample for CD25, as well as FoxP3 expression in the CD4+ lymphocyte gate. (A) Lower panel: Gating strategy for CD3+CTLA4+ cells percentage. Analysis of a blood sample for CTLA4 expression in the CD3+ lymphocyte gate. (B) Flow cytometry analysis of frequencies Treg and CD3/CTLA-4 in blood cells stained with related antibodies of NSCLC and healthy control subjects, which was calculated statistically and plotted to the graph (P ≤ 0.0001). The dots indicate the means, and the error bars indicate the standard deviations of all patients and healthy control measurements.

