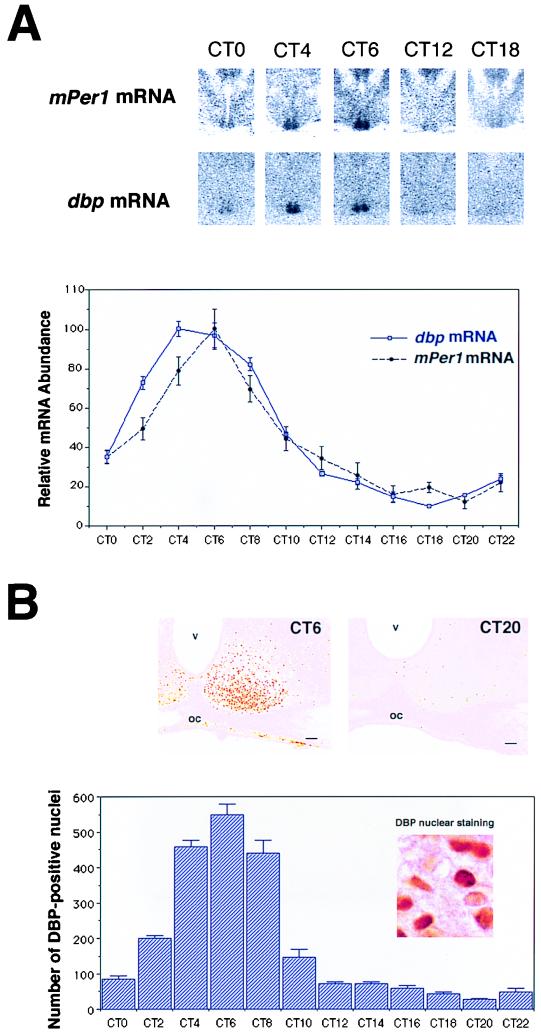
FIG. 4.
Circadian expression of dbp and mPer1 mRNA and DBP protein in the SCN. (A) Quantitative analysis of dbp (open square with blue line) and mPer1 (solid circle with dotted black line) mRNA expressed in the SCN in DD conditions (n = 5, mean ± SEM). Relative dbp and mPer1 mRNA abundance was determined by quantitative in situ hybridization using isotope-labeled probes with the mean peak values adjusted to 100. Representative in situ hybridization autoradiograms at specific time points are shown on the top panels. (B) Circadian expression of DBP immunoreactivity in the SCN. The photomicrographs show immunoreactivity at CT6 and CT20. Cell counts of SCN nuclei staining positive for DBP (per section) are shown. Values are means + SEM for four animals. oc, optic chiasma; v, third ventricle. Bar, 70 μm.

