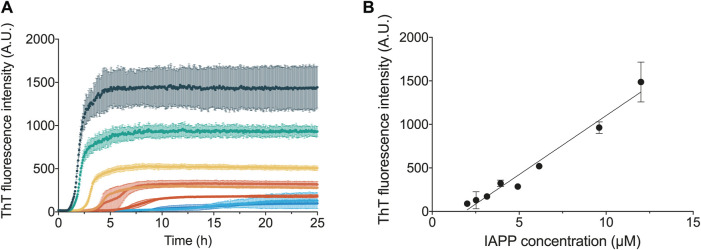
FIGURE 2.
Concentration dependence of IAPP aggregation. (A) ThT fluorescence traces following the aggregation of IAPP over time at varying monomer concentrations, which are represented in different colours. (B) ThT fluorescence amplitude at the end of the aggregation reaction against the IAPP monomer concentration. All the experiments shown in this figure were carried out in 35 mM sodium acetate buffer, pH 5.3, 150 mM KCl.

