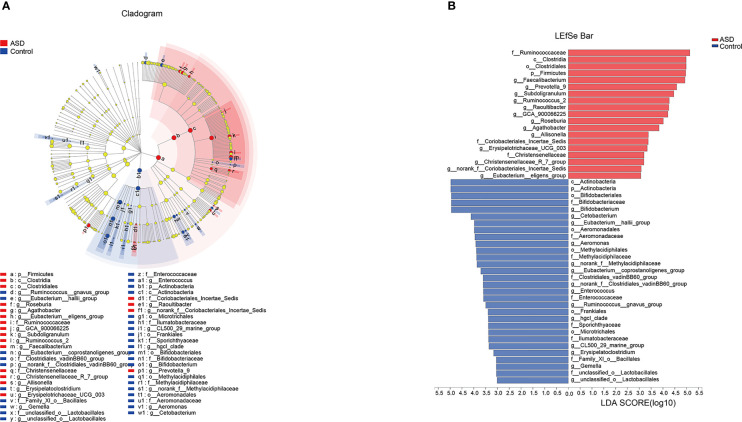
Figure 6.
LEfSe was applied to assess the effect size of each differentially abundant taxon. LDA were performed to identify the most differentially abundant taxa. (A) Cladogram using results of the linear discriminant analysis (LDA) model on the bacterial hierarchy and (B) LDA coupled with effect size measurements identified the differentially abundant taxa between the two groups.

