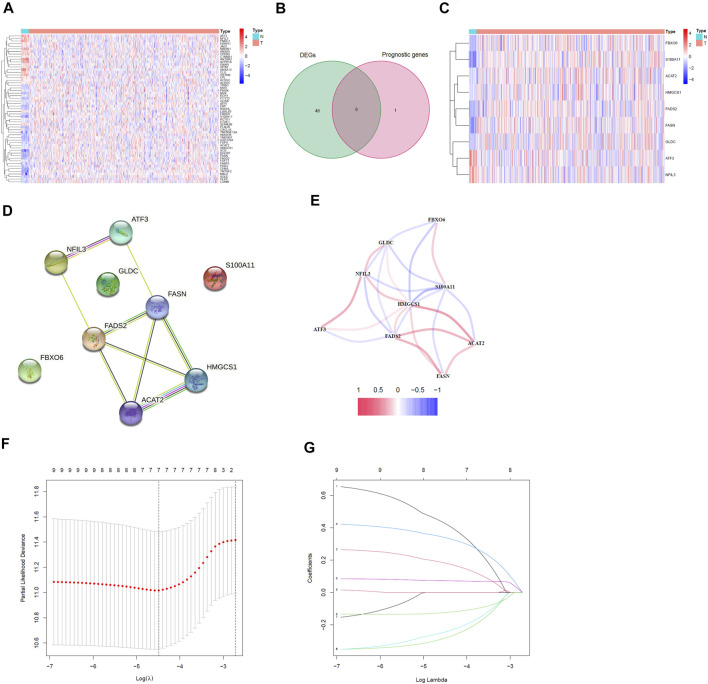
FIGURE 2.
Identification of the prognostic DEGs related to cholesterol homeostasis in EC and the establishment of risk model. (A) Heatmap of 57 cholesterol homeostasis-related DEGs. (B) Venn diagram between DEGs and prognostic genes. (C) Heatmap of nine cholesterol homeostasis related prognostic DEGs. (D) The PPI network of prognostic DEGs. (E) Correlation analysis of prognostic DEGs. (F) The minimum standard and (G) the corresponding coefficient of LASSO Cox regression analysis.

