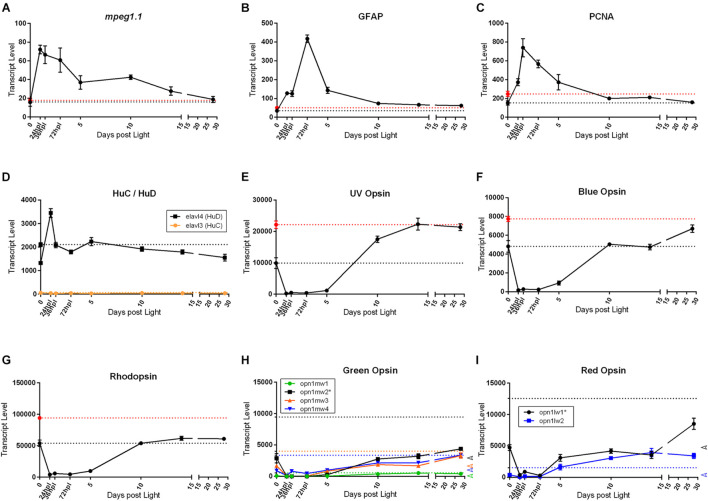
FIGURE 8.
Common genes studied in retinal regeneration with dark adapted 0 h control, and naïve, non-dark adapted control baselines. All graphs in this figure represent transcript pseudo-counts for each of the genes listed above the plots from 3′mRNA-seq of individual adult zebrafish retinas for each timepoint (n = 6). In plots (A–G), the black dotted line on the y-axis represents the baseline gene expression for the dark-adapted 0 h controls, the red dotted line represents the gene expression baseline of age-matched, non-dark-adapted naïve control retinas. In plots (H,I), colored dotted lines on the y-axis correspond to the naïve control baseline gene expression corresponding to the same color of the genes in the key. The dark-adapted control baselines are not highlighted in these plots for ease of interpretation. Instead, on the far-right axis, empty arrowheads corresponding to the 0 h control baseline transcript values are displayed for reference. For inflammatory (A), gliotic (B), proliferative (C), and inner nuclear layer (D) markers, we observe that the dark-adapted 0 h controls and the naïve controls have similar baseline expression and the expression pattern generally resolves to baseline at 28 dpl. The opsins have several distinct patterns of recovery. (E,F) Short wavelength cone opsins recover to the naïve control gene expression baseline whereas (G) Rod photoreceptor opsin expression returns to the dark-adapted 0 h control baseline. (H,I) Medium and long wavelength opsins appear to have different patterns of recovery even between paralogs of the same opsin, with some paralogs returning to the naïve control baseline and some returning to the dark-adapted 0 h control baseline. Asterisks in paralog keys in (H,I) represent the most dominantly expressed paralog at the 0 h baseline for opsins with multiple paralogs.

