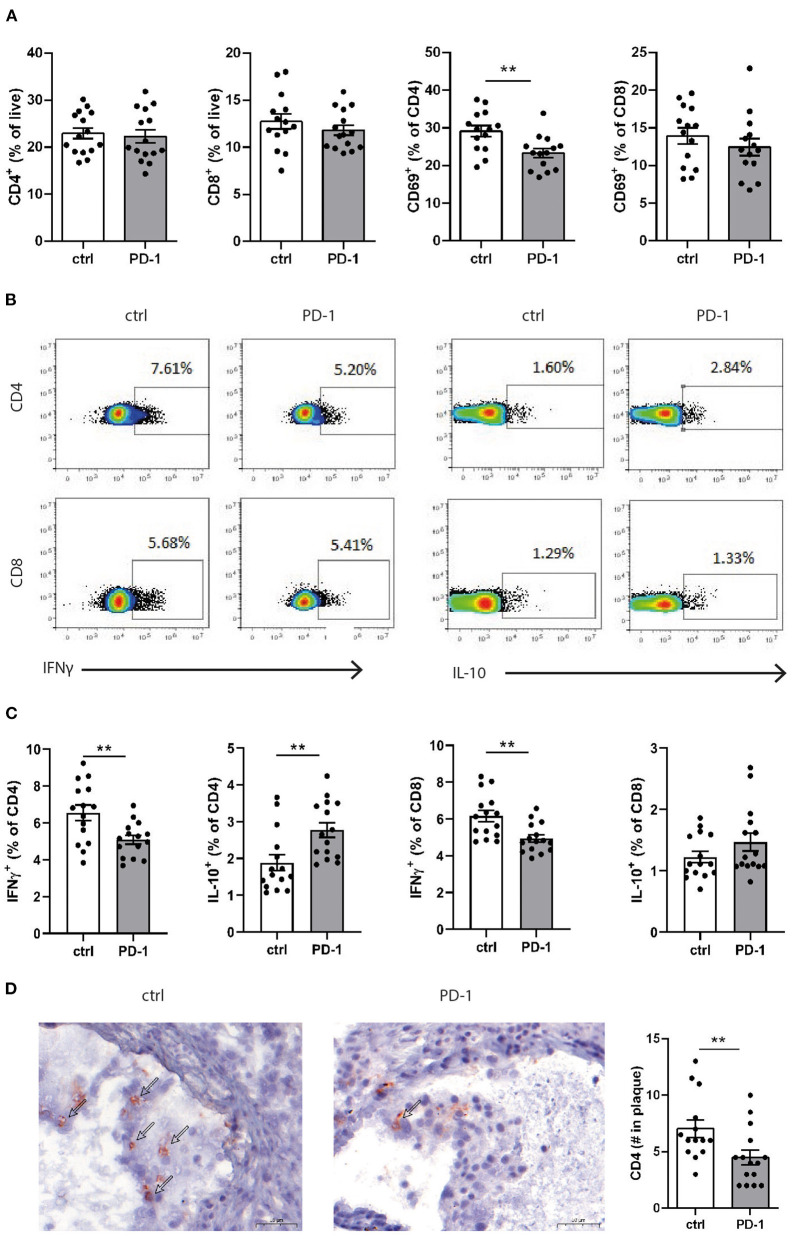
Figure 3.
PD-1 stimulation promotes an anti-atherogenic T cell phenotype. (A) The amount of CD4+ and CD8+ T cells and their expression of CD69 was measured in splenocytes by flow cytometry. To measure intracellular cytokines, splenocytes were stimulated for 4 h with PMA/ionomycin and BrefA. (B) Representative dotplots and (C) data graphs of intracellular IFNγ and IL-10 within CD4+ and CD8+ T cells are shown. (D) CD4+ T cell numbers in the atherosclerotic plaque were manually scored. Scale bars indicate 50 μm. Mean ± SEM are shown. Statistics was performed using unpaired T-test. P ≤ 0.05 are considered significant. **p ≤ 0.01.

