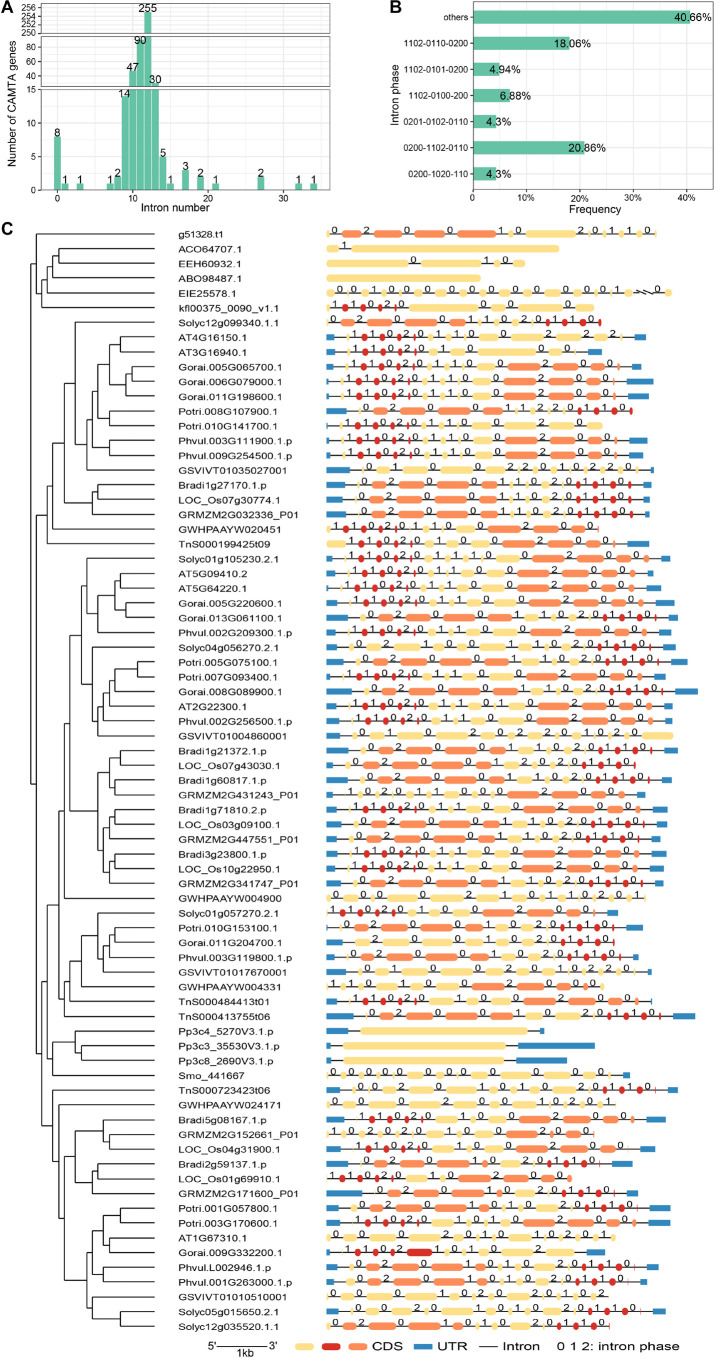
FIGURE 3.
Gene structure analysis of CAMTAs. (A) Distribution of intron number. (B) Percentage of intron phase. (C) CAMTA structures of some representative species. Pink indicates the exons corresponding to intron phase pattern 0200 and 0201, and dark red denotes those corresponding to intron phase pattern 1102 or 0110.

