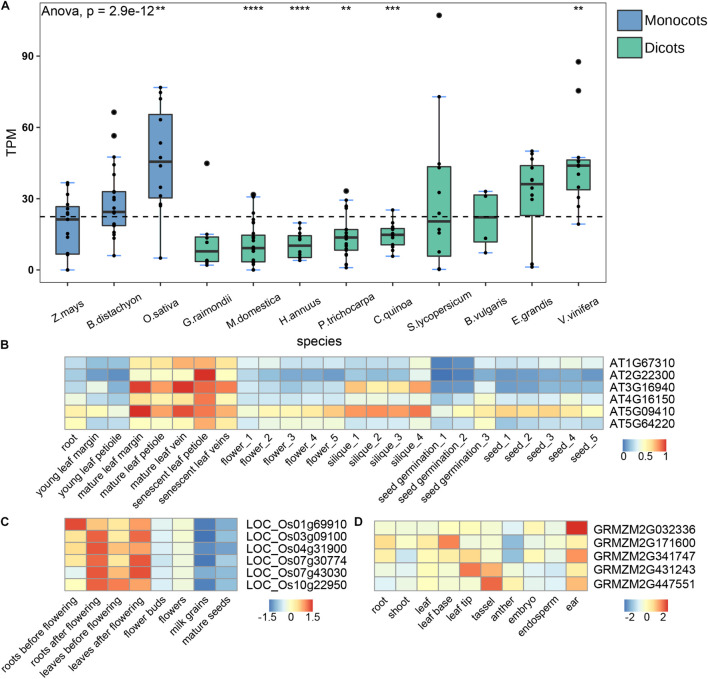
FIGURE 5.
Expression analysis of the CAMTA genes. (A) RNA-seq analysis of different species. The dotted line represents the average gene expression. Box plots indicate the first quartile, the median, and the third quartile. TPM indicates Transcripts Per Kilobase of exon model per Million mapped reads. (B–D) CAMTA expression in different tissues of A. thaliana, O. sativa, and Z. mays. The numbers behind the tissues represent different developmental stages. The symbols of “*”, “**”, “***”, and “****” represent the p-values are 0.05, 0.01, 0.001, and 0.0001, respectively.

