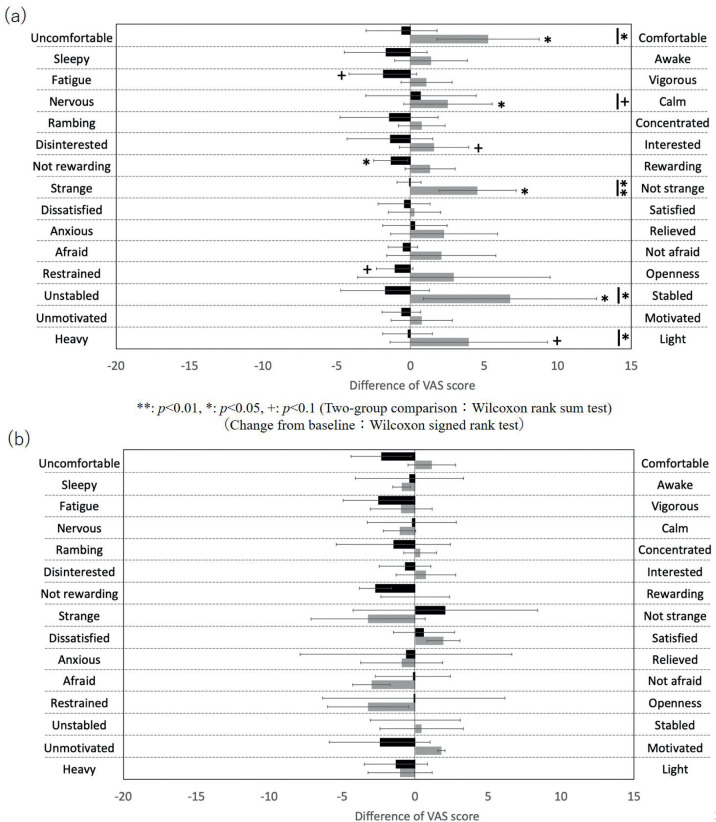
Fig. 2.
Mean difference in the visual analogue scale (VAS) scores before and after the task in (a) healthy subjects (n = 7, error bar: standard deviation (SD)) and (b) patients (n = 3, error bar: SD). Black bars: free mode; grey bars: support mode. The score at the left-hand end of the VAS is defined as 0, the score at the right-hand end as 20, and the mean of the differences in values before and after the task is shown.

