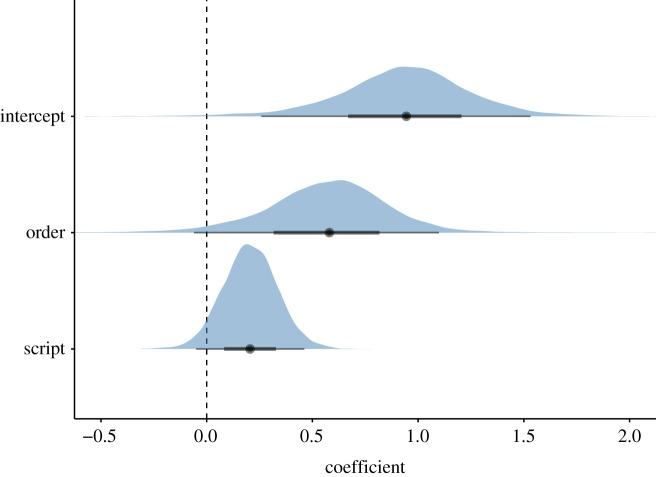
Figure 3.
Posterior distributions of the coefficients from the main model; contrast coding for order predictor: kiki-first = −0.5, bouba-first = + 0.5; weighted effect coding for script predictor: other script = −2.12, Roman = +1; horizontal black lines show the 95% credible interval; thick boxes the 50% interval; points show the median. (Online version in colour.)

