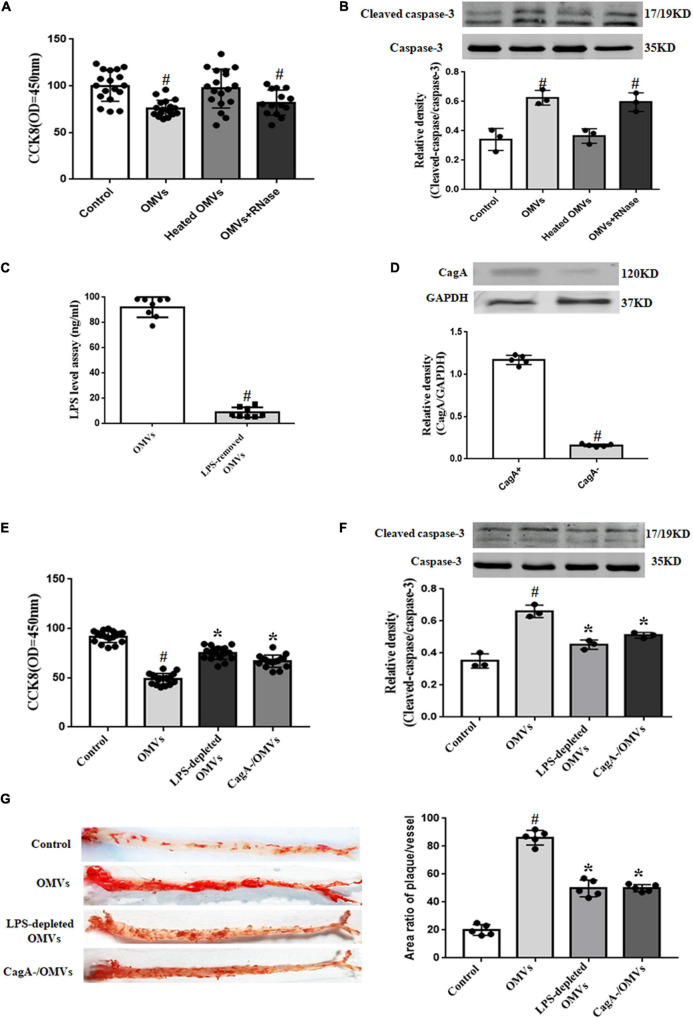
FIGURE 4.
Role of LPS and CagA in H. pylori-derived OMVs-mediated proliferation inhibition and apoptosis in HUVECs. (A,B) HUVECs were administrated with control (vehicle), OMVs (10 μg/mL), heated OMVs or RNase-treated OMVs for 24 h. Proliferation of HUVECs were determined by CCK8 (A) (n = 18, #P < 0.01 vs. control); apoptosis of HUVECs were determined by the ratio of cleaved-caspase-3 to caspase-3 expression (B) (n = 3, #P < 0.01 vs. control). (C) LPS levels were determined by ELISA after treatment with polymyxin B for 1 h at 37°C (n = 8, #P < 0.01 vs. OMVs). (D) CagA levels in CagA-positive or -negative OMVs were determined by immunoblotting (n = 5, #P < 0.01 vs. CagA+). (E,F) HUVECs were administrated with control (vehicle), OMVs (10 μg/mL), LPS-depleted OMVs or CagA-negative OMVs for 24 h. Proliferation of HUVECs were determined by CCK8 (E) (n = 13, *P < 0.05 vs. OMVs or #P < 0.01 vs. control); apoptosis of HUVECs were determined by the ratio of cleaved-caspase-3 to total caspase-3 expression (F) (n = 3, *P < 0.05 vs. OMVs or #P < 0.01 vs. control). (G) Continuous atherosclerosis plaques were measured by Oil Red O staining in ApoE–/– mice treated with control (vehicle), OMVs, LPS-depleted OMVs or CagA– OMVs after 4 weeks (n = 5, *P < 0.05 vs. OMVs or #P < 0.01 vs. control).

