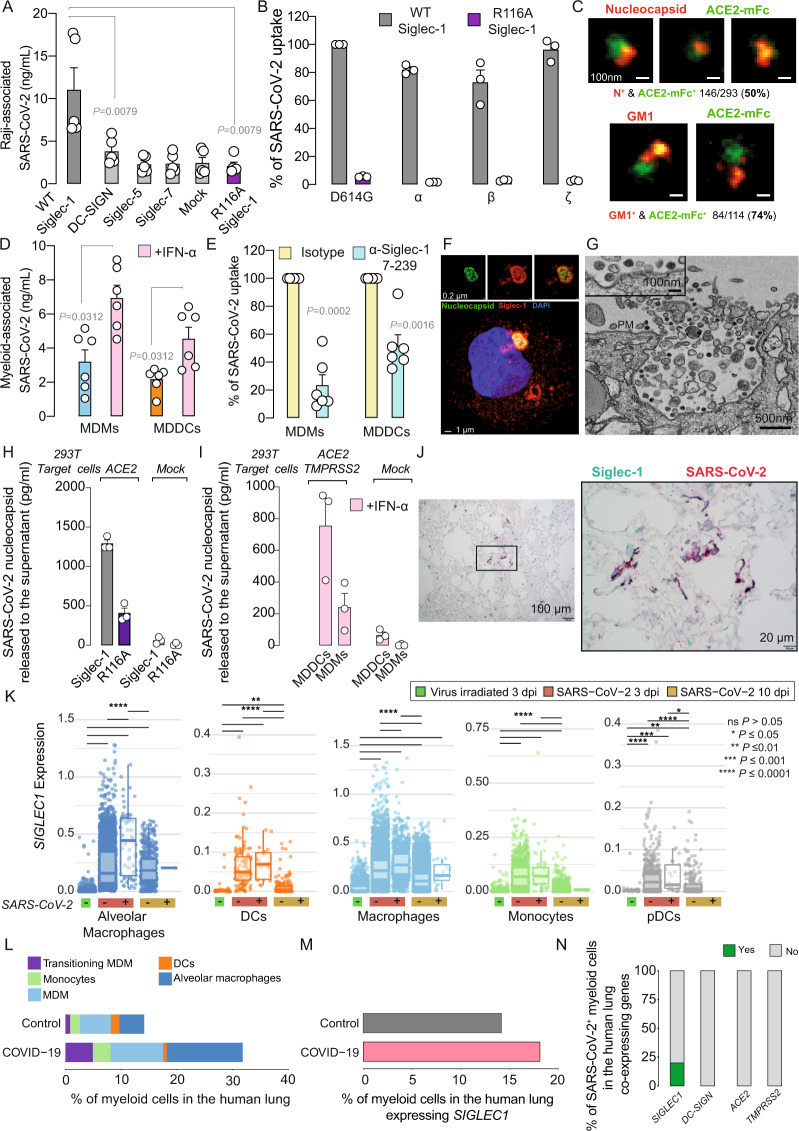
Fig. 1. SARS-CoV-2 trapped via Siglec-1 on MDDCs mediates viral trans-infection of target cells, and in pulmonary tissues, SARS-CoV-2 is detected on APCs expressing Siglec-1.
A Uptake of SARS-CoV-2 by Raji B cells measured by ELISA from two experiments. B Percentage of SARS-CoV-2 variant uptake from one experiment. Values are normalized to D614G strain uptake by Siglec-1 cells, set at 100%. C Superresolution microscopy of SARS-CoV-2 stained with α-nucleocapsid or α-GM1 antibodies (red) and ACE2-mFc (green). The percentage of costaining is shown. D Uptake of SARS-CoV-2 by MDMs and MDDCs activated or not with IFN-α for 48 h from two experiments. E Percentage of viral uptake inhibition of IFN-α-treated APCs preincubated with mAbs from two experiments. Values are normalized to viral uptake by isotype-treated cells, set at 100%. F, G Confocal and electron microscopy of VCCs in LPS- and IFN-α-activated MDDCs exposed to SARS-CoV-2. See Movie 1. PM, plasma membrane. H, I Transmission of SARS-CoV-2 by indicated cells. APCs exposed to SARS-CoV-2 were cocultured with HEK-293T cells expressing ACE2 or not. Viral release from one experiment was measured with an ELISA. J Costaining with α-Siglec-1 and α-SARS-CoV-2 nucleocapsid antibodies in the lungs of an infected rhesus macaque. K SIGLEC1 expression on AGM APCs containing or not containing SARS-CoV-2 RNA. Boxplots show the median, the first and third quartiles and whiskers. L, M Single-cell analysis of pulmonary myeloid cells of 16 COVID-19 patients and 3 controls and APCs expressing SIGLEC1. N Myeloid cells of COVID-19 patients containing viral RNA and coexpressing SIGLEC1, DC-SIGN, ACE2 or TMPRSS2. A, B, D, E, H, and I show mean values and SEMs. Statistical differences were assessed with the Mann–Whitney t test (A), Wilcoxon-matched paired t test (D), one-sample t test (E), Mann–Whitney–Wilcoxon test with Bonferroni correction (K), scCODA (L), chi-square test (M; P = 1.045e−11) or Bonferroni-adjusted chi-square test (N; P = 0.0272624)

