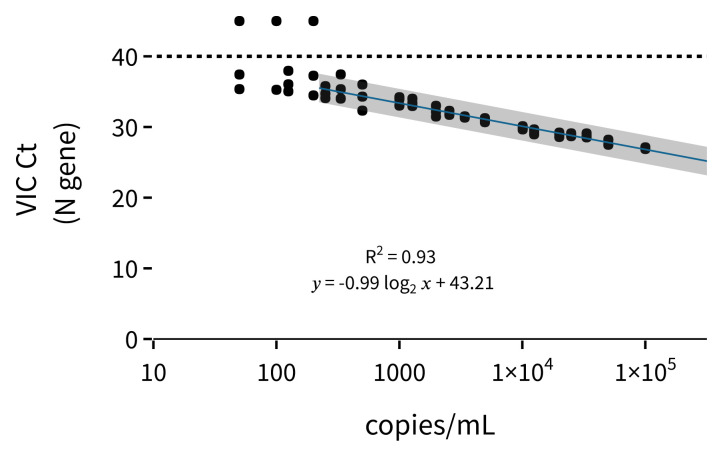
Figure 1. Standard curve of end-to-end RNA extraction and RT-qPCR with concentrations from 100 000 copies/mL to 50 copies/mL of MS2 sVLP containing the N gene.
Each concentration has 3 technical replicates. Dotted line shows the cycle limit of detection. Line of best fit is fit to the Ct values from 250 copies/mL to 100 000 copies/mL. Error is the 95% confidence interval.

