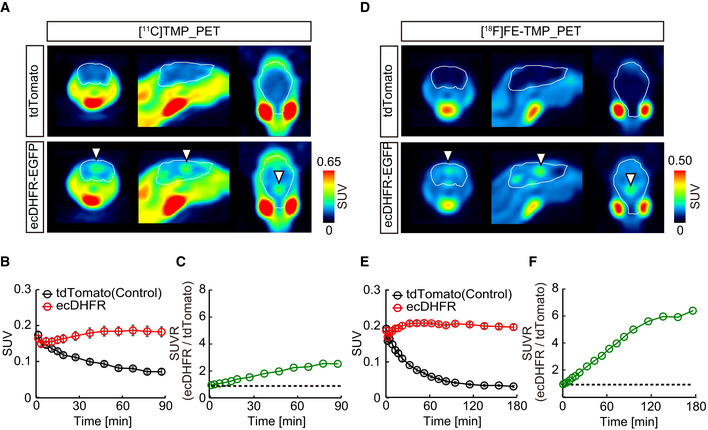
Figure EV2. PET imaging of ecDHFR in mouse brain with radioactive TMP analogs.

-
ARepresentative PET images (coronal, sagittal, and horizontal sections from left) generated by averaging dynamic scan data at 0–90 min after i.v. injection of [11C]TMP. Arrowheads indicate areas of accumulation of radioactive ligand in animals carrying ecDHFR‐EGFP (lower). White lines mark whole brain area as determined by MRI.
-
B[11C]TMP labeling kinetics. Volumes of interest (VOI) of fixed sizes were manually placed on paraventricular region exhibiting high‐level radioactive signals. Data from control (n = 7) and ecDHFR‐EGFP‐expressing mice (n = 7) were plotted as mean ± SEM. F(1, 12) = 22.05; P < 0.01 (two‐way ANOVA).
-
CRatios of averaged [11C]TMP radioactive signals in ecDHFR versus control brains.
-
DRepresentative PET images (coronal, sagittal, and horizontal sections from left) generated by averaging dynamic scan data at 0–180 min after i.v. injection of [18F]FE‐TMP. Arrowheads indicate areas of accumulation of radioactive ligand in animals carrying ecDHFR‐EGFP (lower). White lines mark whole brain.
-
E[18F]FE‐TMP labeling kinetics. VOI analysis was performed as described in panel c. Data from control (n = 6) and ecDHFR‐EGFP‐expressing mice (n = 6) were plotted as mean ± SEM. F(1, 10) = 326.1; P < 0.01 (two‐way ANOVA).
-
FRatios of averaged [18F]FE‐TMP radioactive signals in ecDHFR versus control brains.
Source data are available online for this figure.
