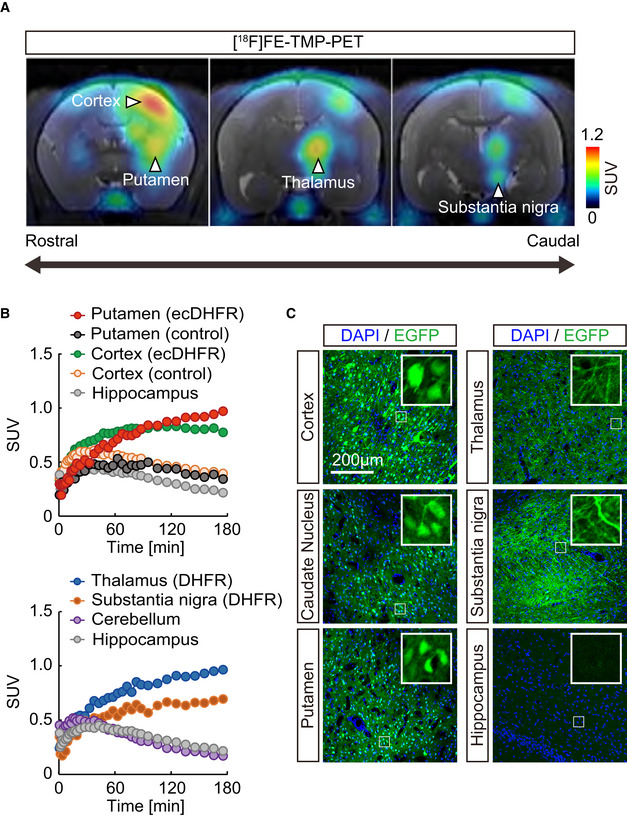
Figure 3. PET imaging of ecDHFR/TMP reporters in primate brain.

- Representative coronal PET images generated by averaging dynamic scan data at 60 ‐ 180 min after i.v. injection of [18F]FE‐TMP. Note that reporter molecules were densely distributed in thalamus and substantia nigra pars compacta, which are connected to the neocortex and putamen via direct neuronal tract, respectively. PET images are overlaid with an individual MRI. Scale bar represents SUV.
- Time‐radioactivity curves for [18F]FE‐TMP in the putamen carrying ecDHFR‐EGFP (red symbols) or control AAV (black symbols), neocortex carrying ecDHFR‐EGFP (green symbols) or control AAV (orange symbols), and hippocampus (gray symbols) are displayed in the upper panel. Curves in the thalamus (blue symbols), substantia nigra (orange symbols), and cerebellum (purple symbols) along with hippocampus data are also shown in the lower panel.
- Postmortem analysis of ecDHFR‐EGFP expression in brain slices. Representative images illustrate EGFP fluorescence in the cortex, caudate nucleus, putamen, thalamus, substantia nigra, and hippocampus. High‐magnification image frames are shown in inserts.
Source data are available online for this figure.
