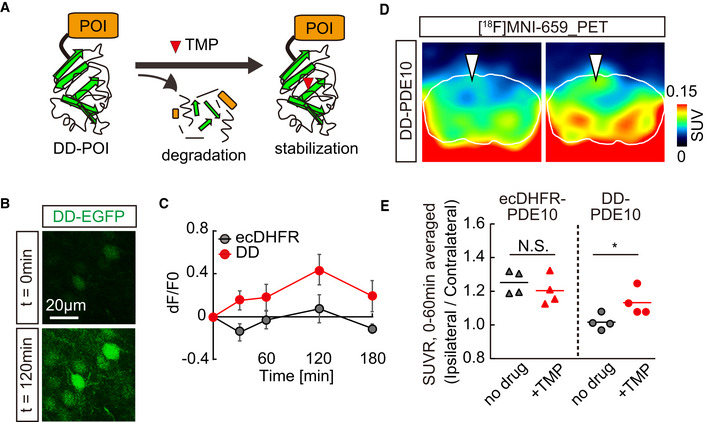
Figure 4. PET analysis of TMP‐inducible protein stabilization.

-
ASchematic illustration of TMP‐dependent control of DD‐POI protein turnover. A protein of interest (POI) fused to a destabilizing domain (DD) undergoes rapid degradation by ubiquitin‐proteasome system, while POI can be stabilized in the presence of TMP.
-
B, CMice expressing fusion proteins comprised of EGFP and either wild‐type or destabilized mutant ecDHFR (ecDHFR‐EGFP or DD‐EGFP, respectively) were imaged by two‐photon microscope. The constructs were introduced into the somatosensory cortex with AAVs. (B) Fluorescent intensity of DD‐EGFP in intact brains of awake animals was analyzed before (0 min) and after (120 min) peripheral administration of TMP (100 mg/kg). Averaged images of 10 stacked frames in serial z position are shown. (C) Averaged ecDHFR‐EGFP and DD‐EGFP fluorescence intensities plotted as dF/F0 ratios at different time points after TMP delivery. Data from 10 neurons for each genotype are plotted as mean ± SD. F(1, 18) = 64.36; P < 0.01 (two‐way, repeated‐measures ANOVA).
-
D, EecDHFR‐PDE10 and DD‐PDE10 were expressed in a caudal region of cortical hemisphere from an AAV. Accumulation of the radioactive signal was monitored by PET scan with [18F]MNI659, a selective radioactive PET ligand against PDE10. (D) Representative PET images demonstrate the detection of TMP‐stabilized DD‐PDE10 in caudal area of neocortex. Averaged images of dynamic scan data at 30–60 min after i.v. injection of [18F]MNI659 are shown. 90‐min scans were conducted before (left) or 2 h after (right) intraperitoneal TMP injection (100 mg/kg). White lines mark the whole brain area as determined by MRI. Note selective accumulation of radioactive signals in the AAV injection site by TMP administration (arrowheads). (E) Averaged SUVR (SUV ratio) of ipsilateral/contralateral radioactive signals during 0–60‐min scans in individual animals expressing ecDHFR‐PDE10 (n = 4) or DD‐PDE10 (n = 4). Data represent mean (horizontal bar) and values from individual animals (dots) for each group under control condition (no drug) or after TMP treatment. t(6) = 2.521; *P < 0.05 (Student’s t‐test). Note a significant TMP‐dependent increase in the ratio in animals carrying a destabilized reporter.
Source data are available online for this figure.
