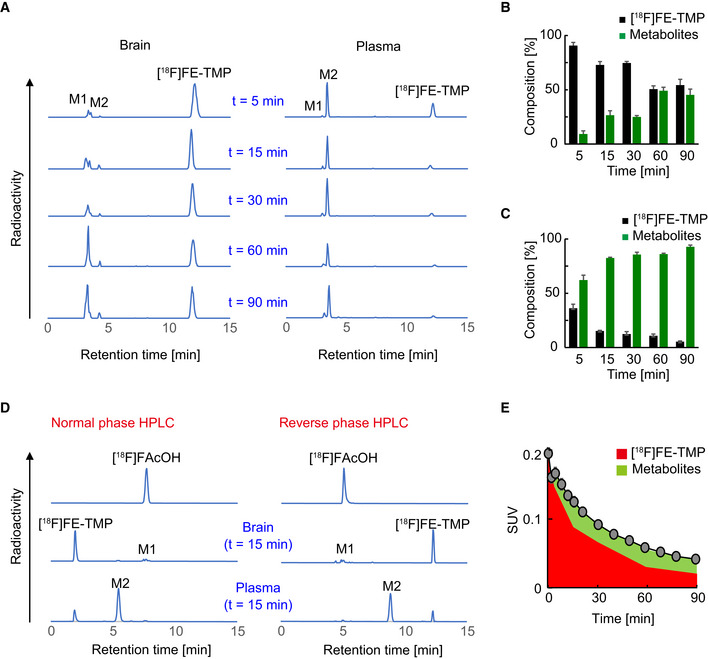
Figure EV4. Characterization of [18F]FE‐TMP radioactive metabolites.

-
ARepresentative reverse phase radio‐HPLC charts showing [18F]FE‐TMP and its radiometabolites, M1 and M2, in brain (left) and plasma (right) of mice at 5, 15, 30, 60, and 90 min after i.v. injection of [18F]FE‐TMP. M1 and M2 are detected as major radiometabolites in brain and plasma, respectively.
-
B, CTime‐course changes in the composition of [18F]FE‐TMP and its radiometabolites in brain (B) and plasma (C). Relative amounts of radiomaterials are indicated as % of total radioactivities at each time point. Data from 3 mice at each time point were plotted as mean ± SD.
-
DIdentification of a major metabolite, M1, by normal (left) and reverse (right) phase radio‐HPLC. Retention times in HPLC charts were compared between radiosynthesized [18F]fluoroacetate ([18F]FAcOH) and radioactive metabolites derived from [18F]FE‐TMP in mouse brain and plasma at 15 min after i.v. administration of [18F]FE‐TMP. Retention time of [18F]FAcOH was identical to that of M1, a major radiometabolite of [18F]FE‐TMP in brain.
-
ERadioactivity derived from [18F]FE‐TMP (red area) and its radiometabolites (green area) in control cortex was calculated by applying temporal changes in their relative abundance (B) to the time‐radioactivity curve shown in Fig EV2E. Data from control mice (n = 6) were plotted as mean ± SEM.
Source data are available online for this figure.
