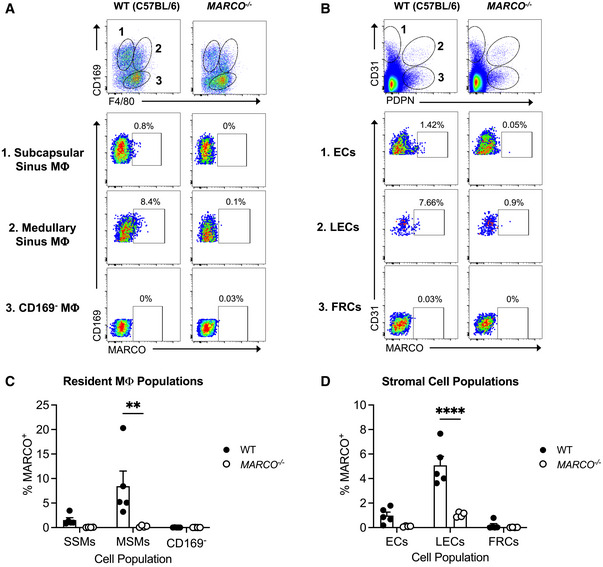
Figure EV2. MARCO is expressed by medullary sinus macrophages and LECs in LNs.

-
A–DLNs were pooled from uninfected WT or MARCO−/− C57BL/6 mice. Representative flow cytometry plots and percentages of MARCO‐expressing cells by resident macrophage populations (A, C) and stromal cell populations (B, D) are shown. Mean ± SEM. Data are pooled from two experiments, n = 4–5. Two‐way ANOVA with Bonferroni’s multiple comparisons test; **P < 0.01, ****P < 0.0001.
