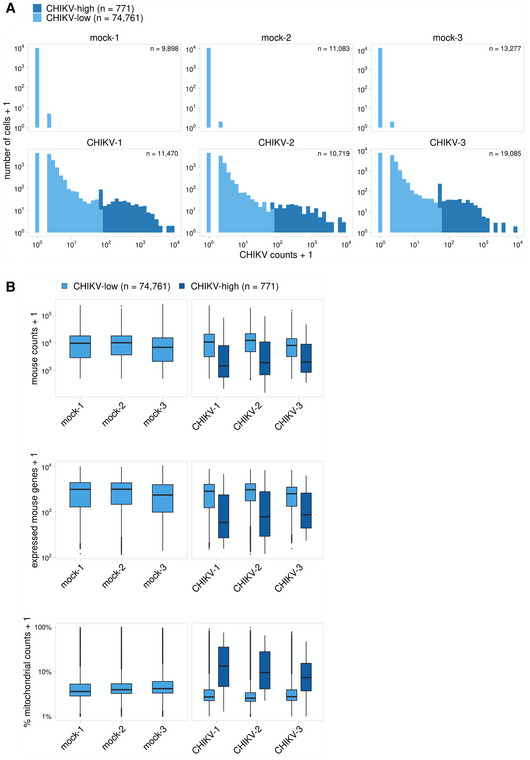
Figure EV5. CHIKV‐high classification and gene expression among CHIKV‐high and CHIKV‐low cells.

- To identify cells with high amounts of viral RNA, cells were first filtered to only include those with > 5 CHIKV counts. K‐means clustering was then used to independently group each biological replicate into CHIKV‐low and CHIKV‐high populations. Cells with ≤ 5 CHIKV counts are included in the CHIKV‐low group. CHIKV counts are shown below for each sample before filtering low‐quality cells (this includes all captured cells).
- Cell quality metrics are shown for CHIKV‐low and CHIKV‐high cells for each replicate. These plots include all captured cells before quality filtering. CHIKV‐high cells have fewer expressed mouse genes and an increased percentage of mitochondrial counts. In the boxplot, the central lines, the box limits, and the whiskers represent medians, the interquartile range (IQR), and min/max values that are not outliers, respectively. Outliers are shown as points and include any values that are more than 1.5× IQR away from the box.
