WT C57BL/6 mice were s.c. inoculated with PBS (mock,
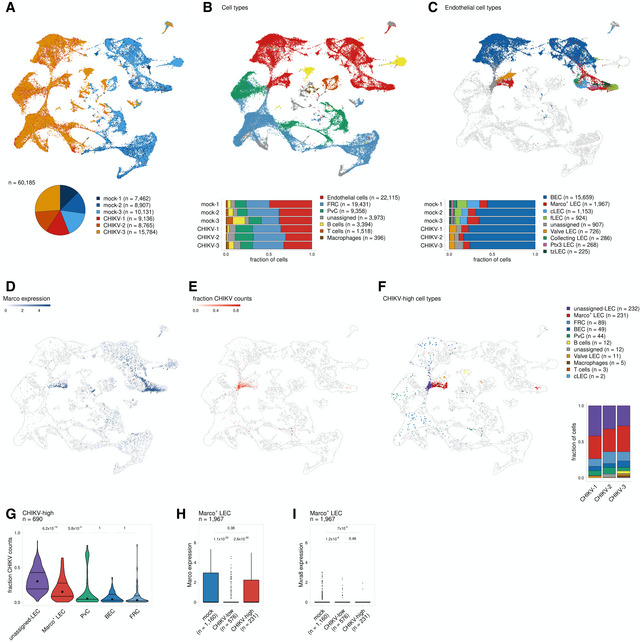
= 3) in the left‐rear footpad. At 24 hpi, the dLN was collected and enzymatically digested into a single‐cell suspension. Cells were enriched for CD45‐ cells and analyzed by scRNA‐seq as described in the Materials and Methods.
-
A
UMAP projection shows each replicate for mock‐ and CHIKV‐infected mice; the number of cells obtained for each replicate is shown at the bottom.
-
B
UMAP projection shows annotated cell types (top) and the proportion of cells identified for each cell type (bottom).
-
C
UMAP projection shows endothelial subtypes (top) and the proportion of cells identified for each cell type (bottom). Non‐endothelial cells are shown in white.
-
D
UMAP projection shows Marco expression.
-
E
UMAP projection shows the fraction of counts that align to the CHIKV genome.
-
F
UMAP projection shows cell types for cells classified as CHIKV‐high. CHIKV‐low cells are shown in white. The proportion of CHIKV‐high cells belonging to each cell type is shown on the right.
-
G
The fraction of counts that align to the CHIKV genome is shown for CHIKV‐high cells. Only cell types that include > 20 cells are shown.
-
H, I
MARCO (H) and Mxra8 (I) expression is shown for MARCO+ LECs for mock‐infected cells and CHIKV‐infected cells classified as either CHIKV low or CHIKV high. P values were calculated using a two‐sided Wilcoxon rank‐sum test with Bonferroni correction. In the boxplot, the central lines, the box limits, and the whiskers represent medians, the interquartile range (IQR), and min/max values that are not outliers, respectively. Outliers are shown as points and include any values that are more than 1.5× IQR away from the box.

