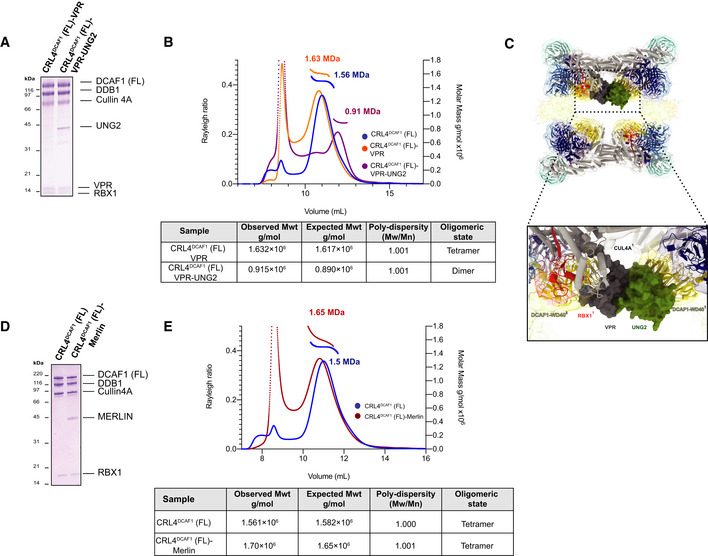
Figure 5. The effect of DCAF1 substrate versus non‐substrate binding proteins on the tetrameric configuration of CRL4DCAF1 .

- SDS–PAGE of the purified CRL4DCAF1 (FL)‐VPR and CRL4DCAF1 (FL)‐VPR‐UNG2 complexes.
- SEC‐MALS analysis, the chromatogram shows Rayleigh ratio curves of CRL4DCAF1 (FL), CRL4DCAF1 (FL)‐VPR, and CRL4DCAF1 (FL)‐VPR‐UNG2, together with the molar mass (MDa) of the main peaks determined by MALS. The table summarizes the observed molecular weight in the main peaks by SEC‐MALS, listing the calculated molecular weight, polydispersity values, and oligomeric states of the tested complexes. The peaks eluting close to the void volume were shown to contain heterogeneous large aggregates (Fig EV5A and B).
- SDS–PAGE of the purified CRL4DCAF1 and CRL4DCAF1(FL)‐MERLIN complexes.
- SEC‐MALS analysis, the chromatogram shows the Rayleigh ratio curves of CRL4DCAF1(FL) (blue) and CRL4DCAF1(FL)‐MERLIN (red) together with the molar mass (MDa) of the main peaks calculated by MALS. The table summarizes the SEC‐MALS observed molecular weights, the calculated molecular weights, polydispersity values, and oligomeric states of the tested complexes. The peak eluting close to the void volume contains large unspecific aggregates (Fig EV5C).
Source data are available online for this figure.
