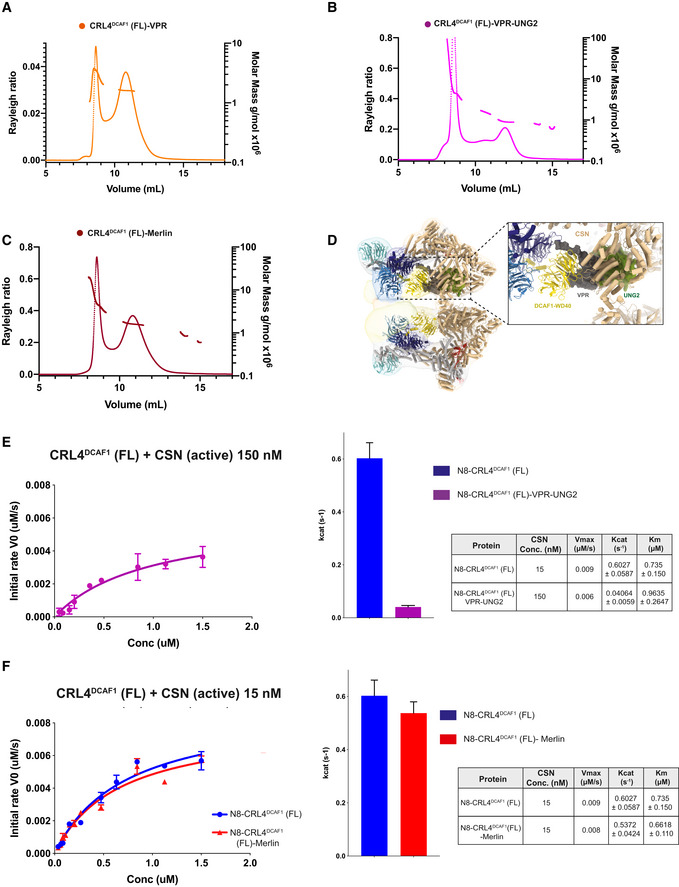
Figure EV5. CSN catalysis on UNG2‐ and MERLIN‐bound N8‐CRL4DCAF1 .

-
A–CSEC‐MALS analysis including the peaks eluting near the SEC column void volume of (A) CRL4DCAF1‐VPR, (B) CRL4DCAF1‐VPR‐UNG2, and (C) CRL4DCAF1‐MERLIN. The chromatogram shows the Rayleigh ratio curves together with the molar mass (MDa) determined by MALS.
- D
-
E, FFluorescence polarization assay investigating the catalytic activity of CSN on N8‐CRL4DCAF1(FL) when bound to (E) VPR‐UNG2 or (F) MERLIN. Initial rates (M/s) are plotted versus concentrations (M) of N8‐CRL4DCAF1(FL)‐VPR‐UNG2 (magenta), N8‐CRL4DCAF1(FL) (blue), and N8‐CRL4DCAF1(FL)‐MERLIN (red). Column representation of Kcat values, and table summarizes KM, Kcat, and Vmax values calculated from the curves (biological replicates, n = 3, mean ± SD).
