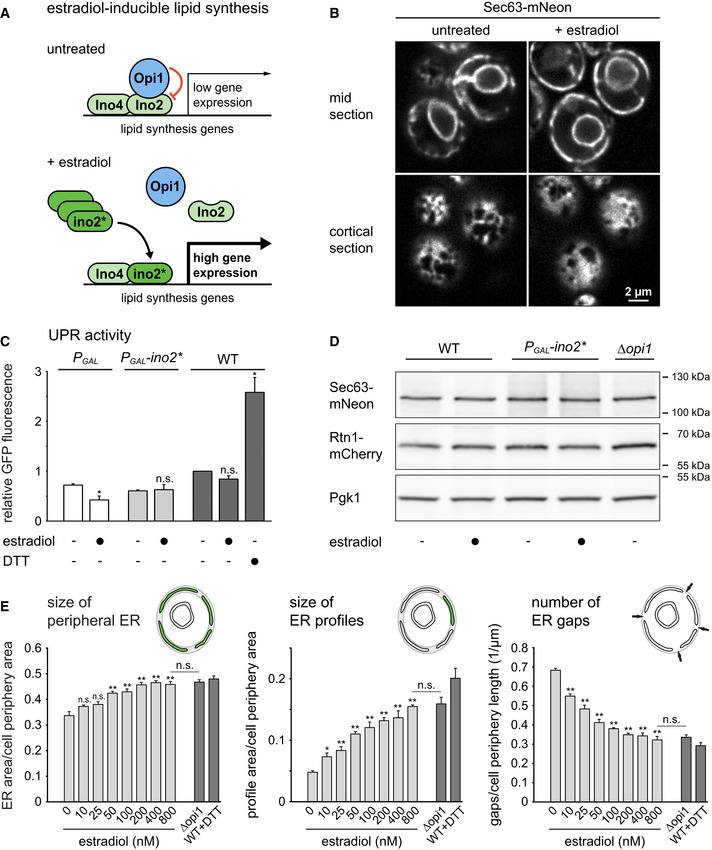
Figure 1. An inducible system for ER membrane biogenesis.

- Schematic of the control of lipid synthesis by estradiol‐inducible expression of ino2*.
- Sec63‐mNeon images of mid and cortical sections of cells harboring the estradiol‐inducible system (SSY1405). Cells were untreated or treated with 800 nM estradiol for 6 h.
- Flow cytometric measurements of GFP levels in cells containing the transcriptional UPR reporter. WT cells containing the UPR reporter (SSY2306), cells additionally harboring an estradiol‐inducible GAL promoter (SSY2307), and cells additionally harboring the system for estradiol‐inducible expression of ino2* under the GAL promoter (SSY2308) were untreated, treated with 800 nM estradiol for 6 h, or treated with 8 mM DTT for 1 h. Data were normalized to untreated WT cells. Bars represent the mean of three biological replicates (n = 3), and error bars are the standard error of the mean (s.e.m.). Asterisks indicate statistical significance compared with the corresponding untreated sample, as judged by a two‐tailed Student’s t‐test assuming equal variance. Exceptions were the tests against the normalized value for wild‐type cells, for which a two‐tailed Student's t‐test with unequal variance was applied. *P < 0.05; n.s., not significant. WT, wild‐type.
- Western blot of Sec63, mCherry, and Pgk1 from WT cells (SSY1404), cells harboring the estradiol‐inducible system (SSY1405) or ∆opi1 cells (SSY1607), all of which expressed Sec63‐mNeon and Rtn1‐mCherry. Cells were untreated or treated with 800 nM estradiol for 6 h. Pgk1 served as a loading control.
- Quantification of ER size in estradiol‐treated cells harboring the inducible system (SSY1405), untreated ∆opi1 cells (SSY1607) and WT cells (SSY1404) treated with 8 mM DTT for 1 h. Bars represent mean + s.e.m., n = 3 biological replicates. Asterisks indicate statistical significance compared with 0 nM estradiol or ∆opi1 cells, as judged by a two‐tailed Student’s t‐test assuming equal variance. *P < 0.05; **P < 0.01; n.s., not significant.
Source data are available online for this figure.
