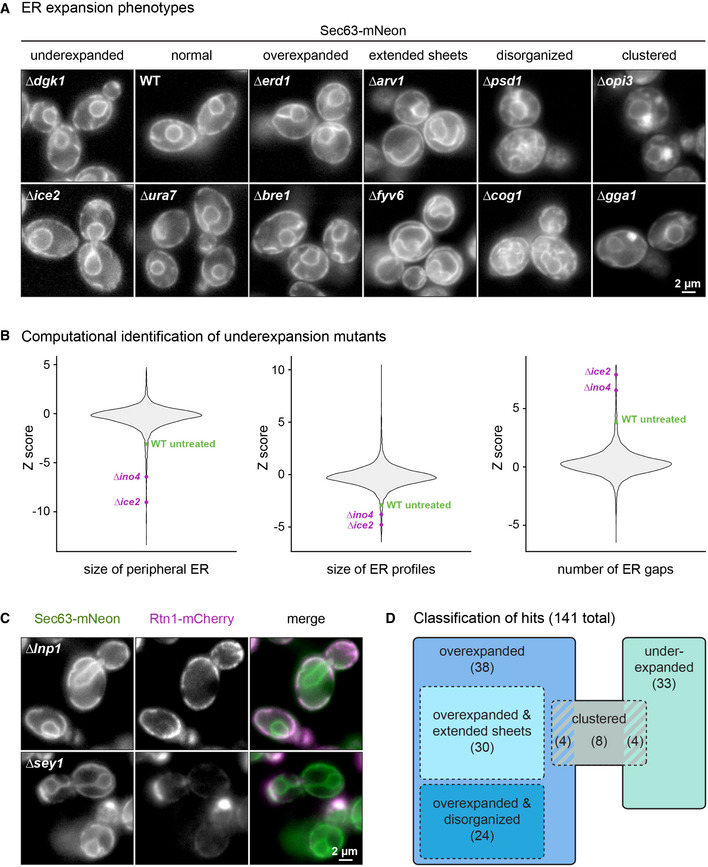
Figure 2. A genetic screen for factors involved in ER membrane biogenesis.

- Sec63‐mNeon images of cells of the indicated genotypes harboring the inducible system. Cells were treated with 800 nM estradiol for 6 h. Two examples of each phenotypic class are shown.
- Violin plots of Z scores from the three metrics for ER size determined for each of the 4,800 mutant strains. The untreated WT is shown for reference.
- Sec63‐mNeon and Rtn1‐mCherry images of ∆lnp1 and ∆sey1 cells harboring the inducible system and treated with 800 nM estradiol for 6 h.
- Classification of hits. Numbers in brackets indicate the number of mutants in each class. Striped areas indicate mutants belonging to two classes.
Source data are available online for this figure.
