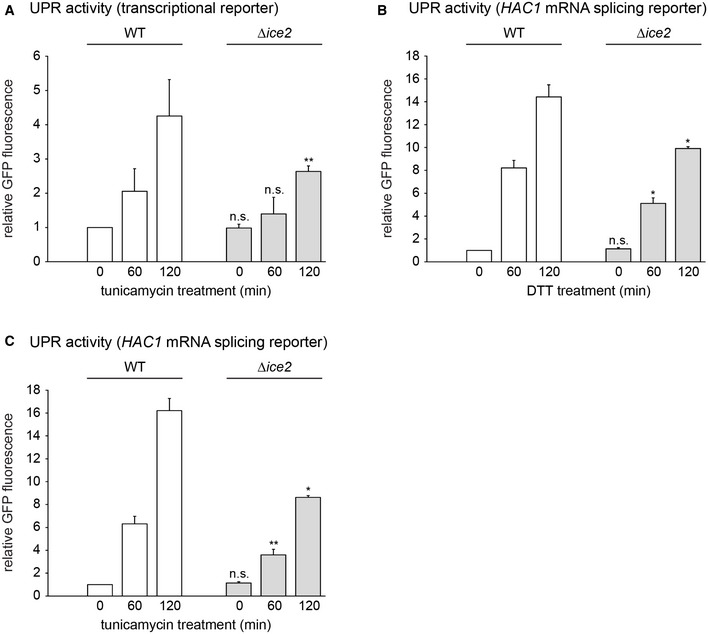
Figure EV2. Deletion of ICE2 impairs UPR signaling during ER stress.

-
AFlow cytometric measurements of GFP levels of WT and Δice2 cells containing the transcriptional UPR reporter (SSY2306, 2312). Cells were treated with 1 μg/ml tunicamycin for the times indicated. Data were normalized to untreated WT cells. Mean + s.e.m., n = 3 biological replicates. Asterisks indicate statistical significance compared with the corresponding value in WT cells, as judged by a two‐tailed Student’s t‐test assuming equal variance. An exception was the test against the normalized value for WT cells, for which a two‐tailed Student's t‐test with unequal variance was applied. **P < 0.01; n.s., not significant.
-
B, CFlow cytometric measurements of GFP levels of WT and Δice2 cells containing the HAC1 mRNA splicing reporter (SSY2309, 2313). Cells were treated with 8 mM DTT (B) or 1 μg/ml tunicamycin (C) for the times indicated. Data were normalized to untreated WT cells. Mean + s.e.m., n = 3 biological replicates. Asterisks indicate statistical significance compared with the corresponding value in WT cells, as judged by a two‐tailed Student’s t‐test assuming equal variance. Exceptions were the tests against the normalized values for WT cells, for which a two‐tailed Student's t‐test with unequal variance was applied. *P < 0.05; **P < 0.01; n.s., not significant.
Source data are available online for this figure.
