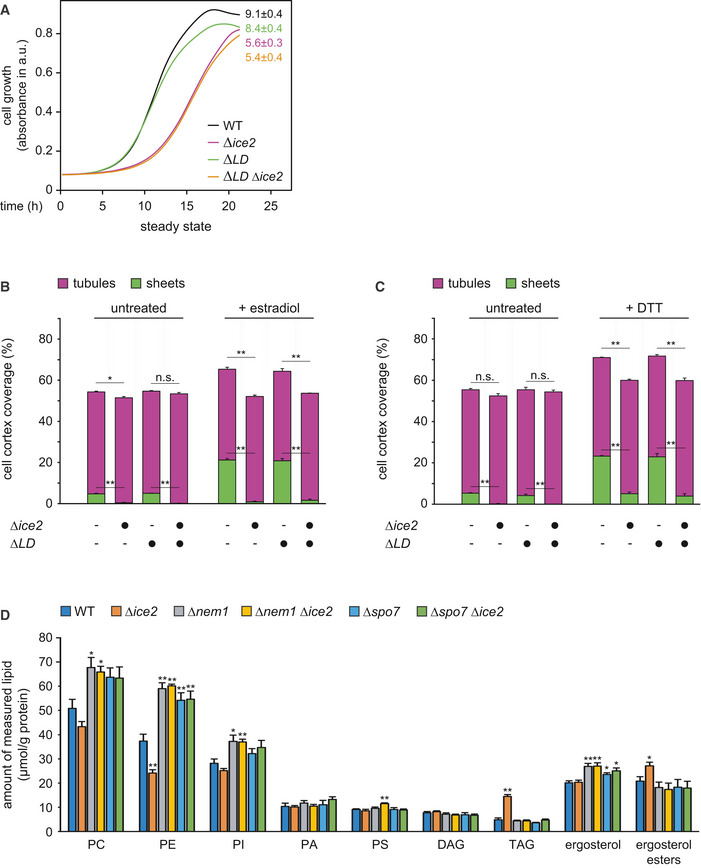
Figure EV3. Absence of lipid droplets has no effect on ER expansion in WT or ∆ice2 cells.

-
AGrowth assays of untreated WT, Δice2, ΔLD, and ΔLD Δice2 cells (SSY2228, 2229, 2230, 2256). Numbers represent areas under the curves and serve as growth indices. Mean + s.e.m., n = 3 biological replicates. ∆LD, ∆lipid droplet.
-
B, CQuantification of peripheral ER structures in WT, Δice2, ΔLD, and ΔLD Δice2 cells harboring the inducible system (SSY2598, 2599, 2600, 2601), which were untreated or treated with either 800 nM estradiol for 6 h (B) or 8 mM DTT for 1 h (C). Bars are the mean percentage of cell cortex covered by tubules (purple) or sheets (green), n = 3 biological replicates. Upper error bars are s.e.m. for the sum of tubules and sheets, and lower error bars are s.e.m. for sheets. Asterisks indicate statistical significance, as judged by a two‐tailed Student’s t‐test assuming equal variance. *P < 0.05; **P < 0.01; n.s., not significant.
-
DLipidomic analysis of WT, Δice2, Δnem1, Δice2 Δnem1, Δspo7, and Δice2 Δspo7 cells (SSY1404, 2356, 2482, 2484, 2481, 2483). Mean + s.e.m., n = 4 biological replicates. Asterisks indicate statistical significance compared with WT cells, as judged by a two‐tailed Student’s t‐test assuming equal variance. *P < 0.05; **P < 0.01. The data are the same as in Fig 5C and D but are shown as lipid‐to‐protein ratios in µg measured lipid per g total protein.
Source data are available online for this figure.
