
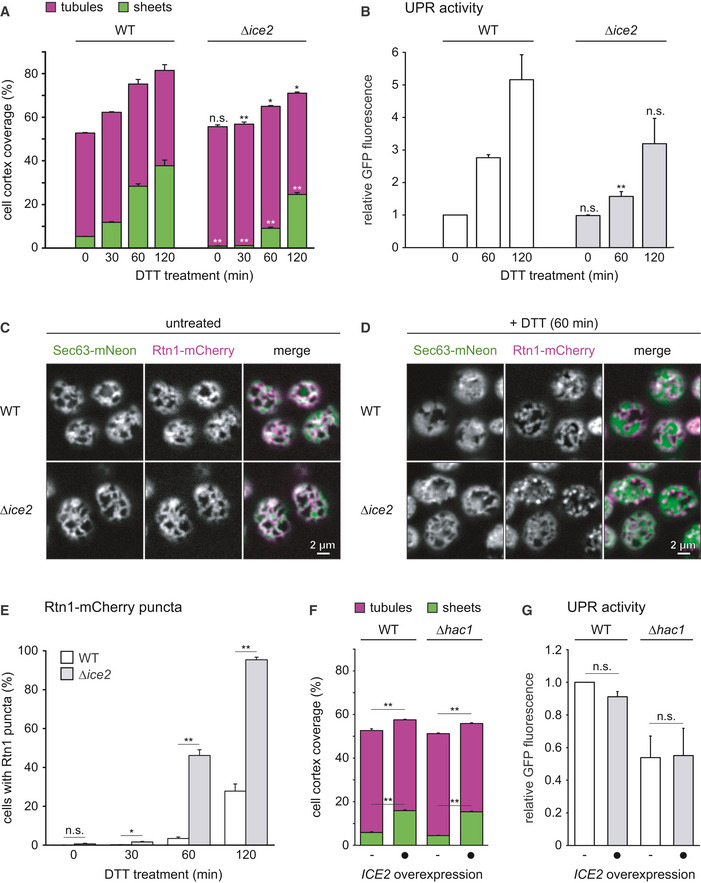
Figure 4. Ice2 is required for ER membrane biogenesis upon ER stress, and ICE2 overexpression is sufficient to induce ER expansion.
-
AQuantification of peripheral ER structures in WT and ∆ice2 cells (SSY1405, 1603) treated with 8 mM DTT for the times indicated. Bars are the mean percentage of cell cortex covered by tubules (purple) or sheets (green), n = 3 biological replicates. Upper error bars are s.e.m. for the sum of tubules and sheets, and lower error bars are s.e.m. for sheets. Asterisks indicate statistical significance compared with the corresponding value in WT cells, as judged by a two‐tailed Student’s t‐test assuming equal variance. *P < 0.05; **P < 0.01; n.s., not significant.
-
BFlow cytometric measurements of GFP levels of WT and Δice2 cells containing the transcriptional UPR reporter (SSY2306, 2312). Cells were treated with 8 mM DTT for the times indicated. Data were normalized to untreated WT cells. Mean + s.e.m., n = 3 biological replicates. Asterisks indicate statistical significance compared with the corresponding value in WT cells, as judged by a two‐tailed Student’s t‐test assuming equal variance. **P < 0.01; n.s., not significant.
-
C, DFluorescence images of cortical sections of WT and Δice2 cells expressing Sec63‐mNeon and Rtn1‐mCherry (SSY1405, 1603) that were untreated (C) or treated with 8 mM DTT for 1 h (D).
-
EQuantification of WT and ∆ice2 cells with Rtn1‐mCherry puncta after treatment with 8 mM DTT for the times indicated. Mean + s.e.m., n = 3 biological replicates. Asterisks indicate statistical significance compared with the corresponding value in WT cells, as judged by a two‐tailed Student’s t‐test assuming equal variance. *P < 0.05; **P < 0.01; n.s., not significant.
-
FQuantification of peripheral ER structures in untreated WT and UPR‐deficient ∆hac1 cells (SSY2228, 2331), overexpressing ICE2 from plasmid pSS761 where indicated. Bars are the mean percentage of cell cortex covered by tubules (purple) or sheets (green), n = 3 biological replicates. Upper error bars are s.e.m. for the sum of tubules and sheets, and lower error bars are s.e.m. for sheets. Asterisks indicate statistical significance compared with the corresponding value in WT cells, as judged by a two‐tailed Student’s t‐test assuming equal variance. **P < 0.01.
-
GFlow cytometric measurements of GFP levels of WT and Δhac1 cells containing the UPR reporter (SSY2306, 2314) and overexpressing ICE2 from plasmid pSS761 where indicated. Data were normalized to untreated WT cells. Mean + s.e.m., n = 3 biological replicates. Asterisks indicate statistical significance compared with the corresponding untreated sample, as judged by a two‐tailed Student’s t‐test assuming equal variance. An exception was the test against the normalized value for WT cells, for which a two‐tailed Student's t‐test with unequal variance was applied. n.s., not significant.
Source data are available online for this figure.