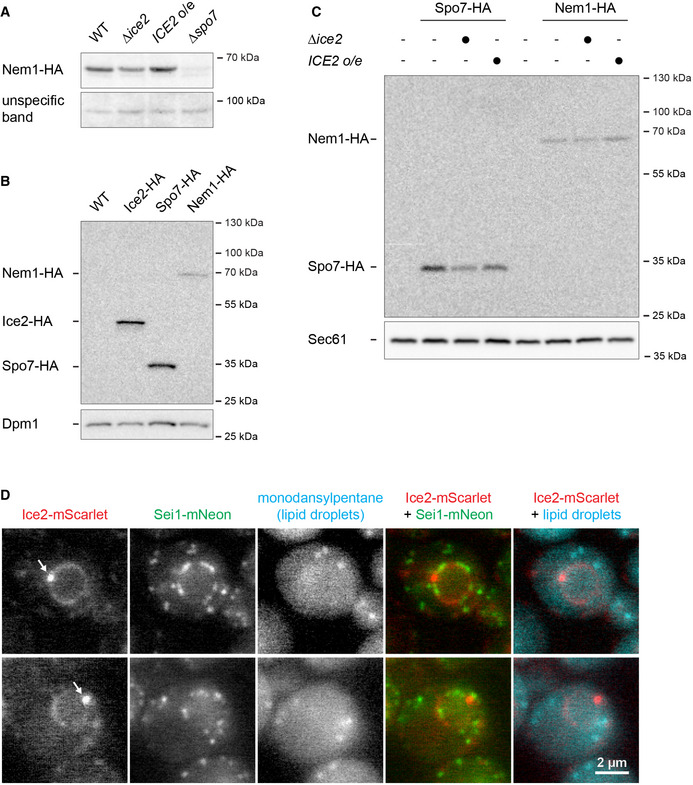
Figure EV4. Abundance of Ice2, Spo7, and Nem1.

- Western blot of HA from total membranes prepared from WT, ∆ice2, and ICE2‐overexpressing and ∆spo7 cells containing Nem1‐HA (SSY2913, 2914, 2915, 2945). An unspecific band served as a loading control.
- Western blot of HA from total cell membranes from WT cells (SSY122) and cells expressing Ice2‐HA, Spo7‐HA, or Nem1‐HA (SSY2421, 2910, 2913). Dpm1 served as a loading control.
- Western blot of HA from total membranes prepared from WT cells (SSY122), WT, ∆ice2, and ICE2‐overexpressing cells containing Spo7‐HA (SSY2910, 2911, 2912), and WT, ∆ice2, and ICE2‐overexpressing cells containing Nem1‐HA (SSY2913, 2914, 2915). Sec61 served as a loading control. o/e, overexpression.
- Images of cells expressing endogenously tagged Ice2‐mScarlet and Sei1‐mNeon (SSY3318) and stained with monodansylpentane to highlight lipid droplets. Arrows indicate foci containing Ice2.
Source data are available online for this figure.
