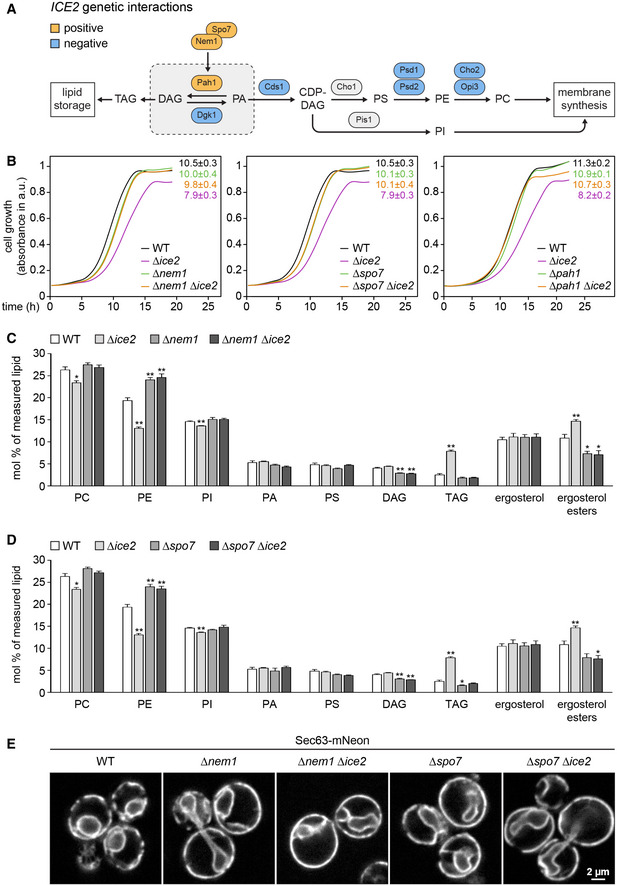
Figure 5. Ice2 is functionally linked to Nem1, Spo7, and Pah1.

-
AGenetic interactions of ICE2 with selected lipid synthesis genes. CDP, cytidine diphosphate; DAG, diacylglycerol; PA, phosphatidic acid; PI/PS/PE/PC, phosphatidylinositol/serine/ethanolamine/choline; TAG, triacylglycerol.
-
BGrowth assays of untreated WT, Δice2, Δnem1, Δnem1 Δice2, Δspo7, Δspo7 Δice2, Δpah1, and Δpah1 Δice2 cells (SSY1404, 2356, 2482, 2484, 2481, 2483, 2807, 2808). Numbers represent areas under the curves and serve as growth indices. Mean + s.e.m., n = 3 biological replicates. Data for WT and ∆ice2 cells are the same in the left and middle panels.
-
C, DLipidomic analysis of WT, Δice2, Δnem1, Δice2 Δnem1, Δspo7, and Δice2 Δspo7 cells (SSY1404, 2356, 2482, 2484, 2481, 2483). Mean + s.e.m., n = 4 biological replicates. Asterisks indicate statistical significance compared with WT cells, as judged by a two‐tailed Student’s t‐test assuming equal variance. *P < 0.05; **P < 0.01. Data for WT and Δice2 cells are the same as in both panels.
-
ESec63‐mNeon images of untreated WT, Δnem1, Δnem1Δice2, Δspo7, and Δspo7 Δice2 cells (SSY1404, 2482, 2484, 2481, 2483).
Source data are available online for this figure.
