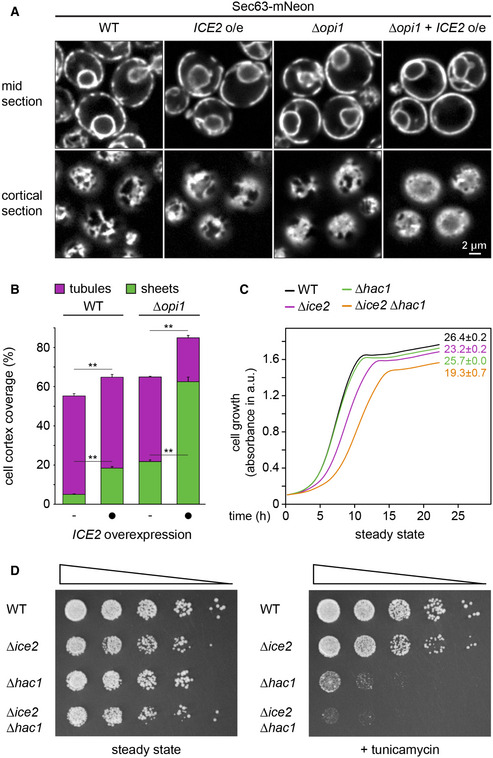
Figure 9. Ice2 cooperates with the PA‐Opi1‐Ino2/4 system and promotes ER homeostasis.

- Sec63‐mNeon images of mid and cortical sections of untreated WT and ∆opi1 cells, overexpressing ICE2 where indicated (SSY1404, 2588, 2595, 2596).
- Quantification of peripheral ER structures in the strains shown in panel (A). Bars are the mean percentage of cell cortex covered by tubules (purple) or sheets (green), n = 3 biological replicates. Upper error bars are s.e.m. for the sum of tubules and sheets, and lower error bars are s.e.m. for sheets. Asterisks indicate statistical significance compared with control cells not overexpressing ICE2, as judged by a two‐tailed Student’s t‐test assuming equal variance. **P < 0.01.
- Growth assays of untreated WT, ∆hac1, Δice2, and Δhac1 Δice2 cells (SSY1404, 2356, 2805, 2806). Numbers represent areas under the curves and serve as growth indices. Mean + s.e.m., n = 3 biological replicates.
- Growth assays on solid media of WT, ∆hac1, Δice2, and Δhac1 Δice2 cells (SSY1404, 2356, 2805, 2806) in the absence or presence of 0.2 μg/ml tunicamycin. For each series, cells were diluted fivefold from one step to the next.
Source data are available online for this figure.
