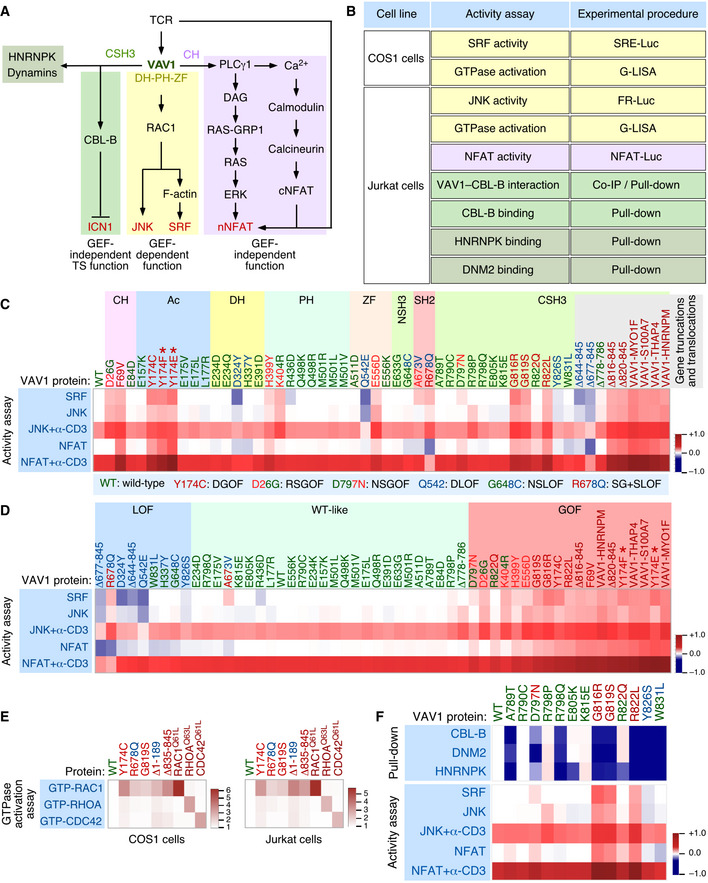
Figure 1. Functional impact of VAV1 mutations in the RAC1 and NFAT pathways.

-
ADepiction of the three main signaling branches of VAV1 in T cells. Additional binding partners of the CSH3 domain that will be studied in this work are also shown. Signaling crosstalk between the NFAT route and parallel TCR‐triggered pathways is also depicted. DAG, diacylglycerol; RAS‐GRP1, Ras GDP releasing protein 1; cNFAT, cytosolic NFAT; nNFAT, nuclear NFAT. Rest of abbreviations have been introduced in the main text.
-
BVav1‐dependent biological readouts and cell types used to test the biological activity of Vav1 mutant proteins. The color of each assay represents the VAV1‐regulated downstream pathway shown in panel (A). Please, note that the GTPase activation and protein–protein interaction experiments were done with smaller subsets of mutants than the JNK, SRF, and NFAT experiments.
-
C, DHeatmap representations summarizing the activity of VAV1 mutants (top) in the indicated assays tested (left). The mutations are clustered according to their specific distribution within the primary structure of the protein (C) and type of behavior in these experiments with the rest of mutants tested (D). Activity scores are depicted on a dark blue (lowest activity) to dark red (highest activity) scale relative to the activity levels found for Vav1WT under nonstimulated conditions (which was given an arbitrary value of 1) (n = 3 independent experiments, each performed in triplicate). The color code used for each mutant is associated with the biological activity exhibited in these assays following the color code indicated in (C) (bottom box). DGOF, double gain of function in RAC1 and NFAT pathways; RSGOF, RAC1 single gain of function; NSGOF, NFAT single gain of function; DLOF, double loss of function; NSLOF, NFAT single loss of function; SG+SLOF, RAC1 gain of function and NFAT loss of function. The laboratory‐made VAV1 mutants used as positive control are indicated by asterisks.
-
EHeatmap representation summarizing the activity of VAV1 mutants (top) in COS (left panel) and Jurkat (right panel) cells on the indicated GTPases. Activity scores are depicted on a white (WT activity) to dark red (highest activity) scales relative to the activity levels found for Vav1WT (which was given an arbitrary value of 1). n = 3 independent experiments, each performed in duplicate. The color code used for each mutant is as in panels (C and D). Activated RHO‐GTPase proteins (Rac1Q61L, RhoAQ63L, and Cdc42Q61L) were used as positive control in the appropriate assay.
-
FTop, heatmap summarizing the results obtained in our GST pull‐down experiments with the indicated CSH3 mutant proteins. Binding partners tested are shown on the left. The mutations are represented in a sequential manner and following the color code used in panels (C and D). Activity scores are depicted on a dark blue (lowest interaction) to dark red (highest interaction) scale relative those obtained with the CSH3WT (which was given an arbitrary value of 1) (n = 3 independent experiments). Bottom, heatmap showing the biological activity of the indicated CSH3 mutants obtained in the experiments described in panels (C and D). This heatmap has been included to facilitate the comparison of the activities of these mutants in all the assays used in this figure.
Source data are available online for this figure.
