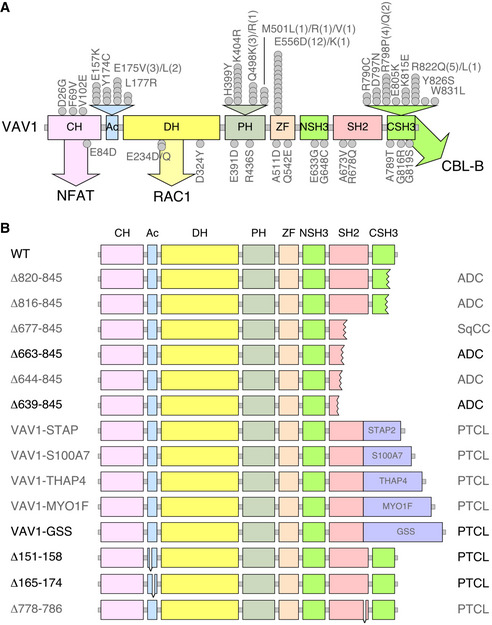
Figure EV1. Tumor‐associated VAV1 mutations.

- Localization of VAV1 missense mutations identified in PTCL (top) and NSCLC (bottom) in the primary structure of the protein. Each dot represents one patient. Abbreviations for domains have been described in main text. Mutations analyzed in this study are shown in gray color. The main pathways activated by the VAV1 domains are indicated. CH, calponin homology; Ac, acidic; DH, Dbl homology; PH, pleckstrin homology; ZF, zinc finger; NSH3, most N‐terminal SH3 domain; CSH3, most C‐terminal SH3.
- Examples of C‐terminal truncations (top, proteins 1 to 6), translocations affecting the C‐terminal end (middle, proteins 7 to 11, fused protein indicated as a violet box), and internal gene deletions (bottom, proteins 12 to 14) found in human patients. Mutations analyzed in this study are shown in gray font. Those not tested are in black font.
