Main
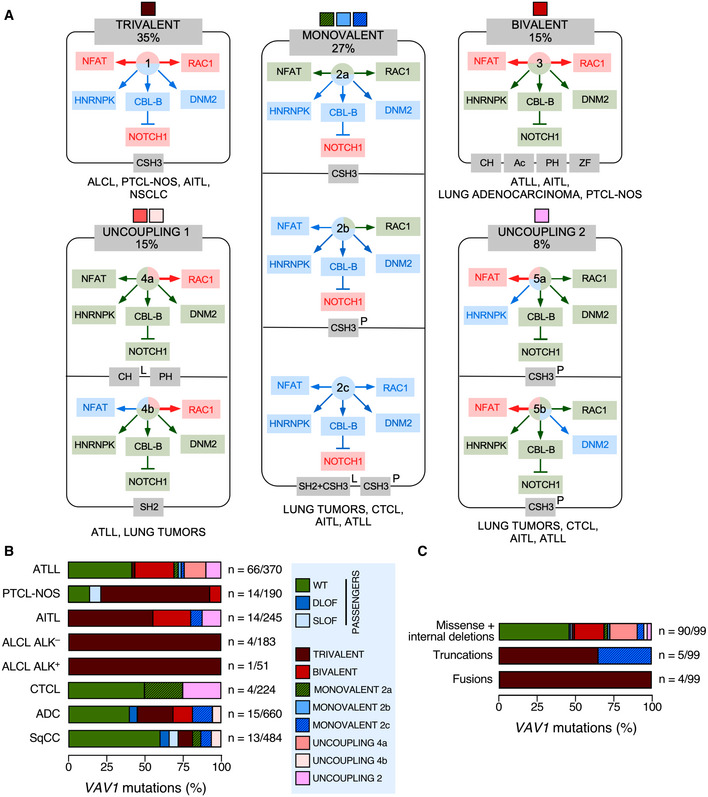
VAV1 mutation functional subclasses according to the data obtained in Fig
1. The color code of each subclass shown at the top will be used in panels (B and C) to facilitate the identification of each of them. The percentage of each mutant subclass (relative to all the deregulated
VAV1 mutants tested) is also indicated at the top. The GOF and LOF effects of each mutant subclass are shown in red and blue colors (boxes and arrows). WT‐like activity is depicted as green arrows and boxes. The domains targeted by the mutations are shown in gray boxes at the bottom of each subclass. The tumors where the mutations have been found are shown at the bottom of each subclass. L, lung cancer; P, peripheral T‐cell lymphoma.

