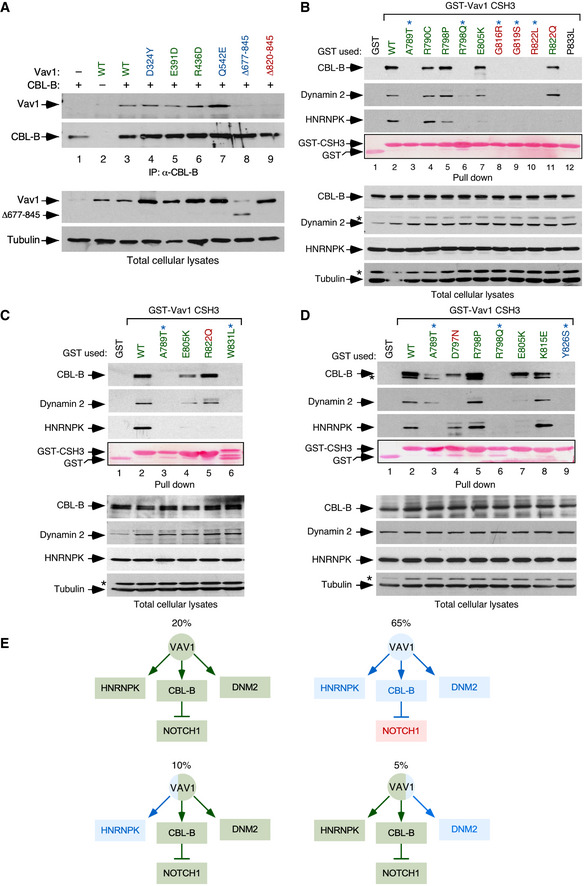
Figure EV2. CSH3 mutations alter the interaction between VAV1 and binding partners.

-
ACo‐immunoprecipitation of indicated Vav1 proteins with CBL‐B in Jurkat cells ectopically expressing the indicated combinations of proteins (top). Amount of immunoprecipitated CBL‐B was assessed by reblotting the same filter with antibodies to CBL‐B (second panel from top). Expression of ectopic VAV1 proteins (third panel from top) and endogenous tubulin α (loading control, bottom panel) was determined by immunoblotting using aliquots of the total cellular lysates used in the immunoprecipitation step. The color code of the mutant residues follows the criteria used in Fig 1C and D.
-
B–DRepresentative examples of the interactions found in Jurkat cells among GST‐tagged proteins fused to the indicated CSH3 versions of Vav1 and the endogenous CBL‐B, Dynamin 2, and HNRNPK proteins. In all cases, the relative amount of bait used in the pull‐down assays is shown in the fourth panel from top. Expression of the endogenous proteins was determined by immunoblotting using aliquots of the total cellular lysates used in the pull‐down step. Asterisks in the second and fourth panels in the total cellular lysate panels pinpoint the CBL‐B and HNRNPK immunoreactive bands from the previous immunoblot of the same filter, respectively. In (D), asterisk in the first panel in the pull‐down panels indicates the Dynamin 2 band from the previous immunoblot of the same filter. Similar results were obtained in three additional experiments. GST‐VAV1P833L, negative control of interaction (it bears a mutation that inactivates the binding properties of the domain). The color code of the mutant residues follows the criteria used in Fig 1C and D.
-
ESummary of binding alterations found in the Vav1 CSH3 mutants. Proper binding is shown as green boxes and arrows. Lack of binding is shown as blue boxes and arrows. The activation of NOTCH1 signaling is depicted as a red box. The percentage of each mutant subclass (relative to all CSH3 mutants tested) is indicated at the top of each functional subgroup.
Source data are available online for this figure.
