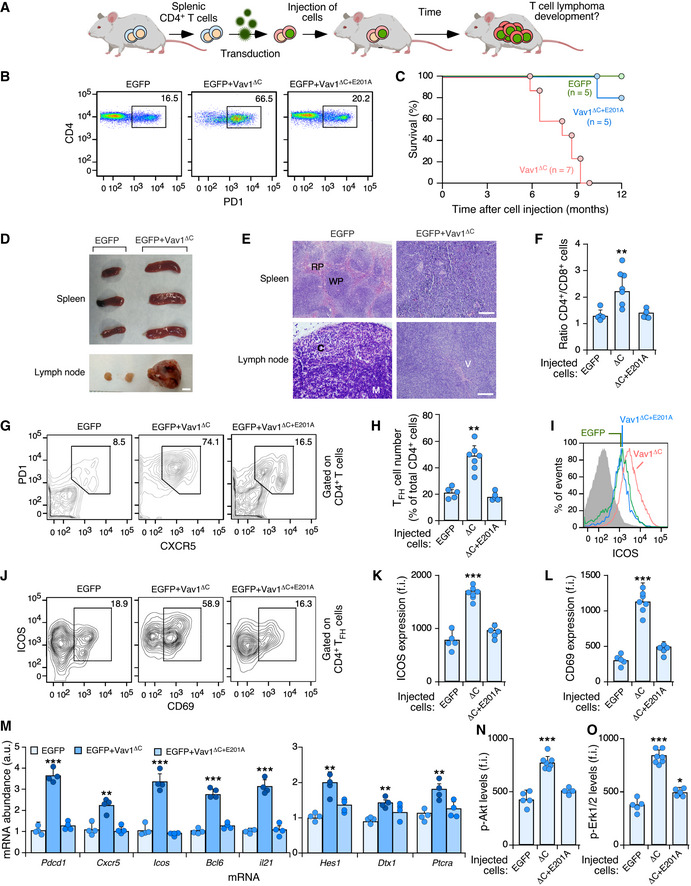
Figure 4. Vav1ΔC drives PTCL formation when expressed in CD4+ T cells.

-
ADepiction of adoptive T‐cell transfer experiments used in this figure. See Materials and Methods for further details.
-
BFlow cytometry detection of PD1+ CD4+ T cells in the peripheral blood from recipient mice 6 months after being transplanted with CD4+ T cells expressing the indicated proteins (top). Numbers indicate the relative percentage (%) of the EGFP+ population (boxed) found in each case. Same results were obtained in recipient mice transplanted with EGFP‐ (n = 5), Vav1ΔC‐ (n = 7) and Vav1ΔC+E201A‐transduced (n = 5) CD4+ T cells.
-
CSurvival curves of mice transplanted with CD4+ T cells expressing the indicated proteins. The number of animals used is indicated in the graph. Note: The mouse transplanted with EGFP‐transduced cells that has died in these experiments did not show any sign of tumor development according to anatomopathological analyses (data not shown).
-
DRepresentative images of spleen and lymph nodes from recipient mice transplanted with cells expressing the indicated combination of proteins (top) at the time of euthanasia. Scale bar, 1 cm.
-
ERepresentative examples of hematoxylin–eosin‐stained sections of a spleen (top) and a lymph node (bottom) from recipient mice transplanted with the indicated cells (top) at the time of euthanasia. Scale bars, 100 μm. n = 4 animals per class analyzed. RP, red pulp; WP, white pulp; C, cortex; M, medulla; V, venules.
-
FQuantification of CD4+ versus CD8+ T‐cell ratio in peripheral blood from mice transplanted with CD4+ T cells expressing the indicated proteins (bottom). Each point represents the measurement of an individual mouse. n as in (B).
-
GSurface expression of PD1 and CXCR5 in CD4+‐gated splenocytes from recipient mice transplanted with CD4+ T cells expressing the indicated combination of proteins (top). Numbers indicate the relative percentage (%) of the cell population that has been interrogated (boxed).
-
HQuantification of the percentage of TFH cells in CD4+‐gated splenocytes isolated the indicated experimental conditions. Each point represents the measurement of an individual mouse. n as in (B).
-
IExample of a flow cytometry determination of ICOS expression in TFH cells from recipient mice transplanted with cells expressing the indicated proteins. The gray shaded histogram represents the fluorescence obtained with the isotype‐matched control antibody.
-
J–LRepresentative flow cytometry analysis (J) and quantification of the surface levels of ICOS (K) and CD69 (L) in TFH cells from mice transplanted with CD4+ T cells expressing the indicated proteins. In (J), numbers indicate the relative percentage (%) of the cell population that has been interrogated (boxed). In (K and L), each point represents the values obtained with a single experimental mouse. n as in (H).
-
MAbundance of indicated transcripts (bottom) in splenic cells from control (EGFP+), tumor‐bearing mice (expressing EGFP and Vav1ΔC) and mice transplanted with cells transduced with the catalytically dead version of Vav1ΔC (expressing EGFP and Vav1ΔC+E201A). Values are given relative to the expression of each transcript in samples obtained from EGFP controls (which was given an arbitrary value of 1). n = 4 animals per class analyzed. a.u., arbitrary unit.
-
N, OFlow cytometry determination of p‐Akt (N) and p‐Erk1/2 (O) levels in CD4+ TFH‐gated splenocytes from recipient mice transplanted with cells expressing the indicated proteins (bottom). In both panels, each point represents the values obtained with a single experimental mouse. n as in (H).
Data information: In panels (F, H, K, L, M, N, and O), data represent the mean ± SEM. Statistical values obtained using the Student’s t are given relative to control EGFP+ cells. *P ≤ 0.05; **P ≤ 0.01; ***P ≤ 0.001.
Source data are available online for this figure.
